
Figure 3
- ID
- ZDB-FIG-230315-26
- Publication
- Fotowat et al., 2023 - Neural circuits underlying habituation of visually evoked escape behaviors in larval zebrafish
- Other Figures
- All Figure Page
- Back to All Figure Page
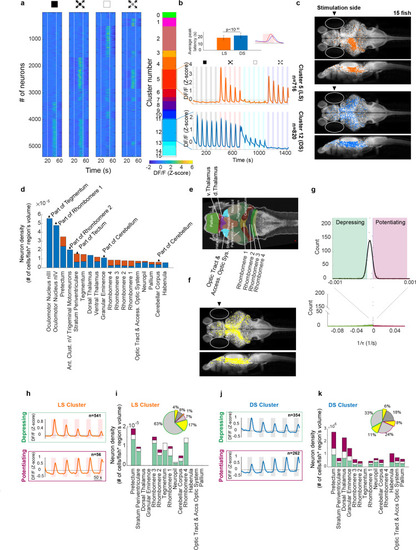
(a) First four panels show trial averages of neurons responsive to one or more of the stimulus types. Neurons were sorted based on their 4-digit binary code corresponding to higher than threshold correlation of trial averages with dimming, dark looming, brightening, or checkerboard stimuli (interstimulus interval [ISI] = 40 s,l/|v| = 480 ms). The fifth panel shows the decimal cluster number corresponding to the binary code obtained after thresholding correlation levels of trial averages with the stimulus (see Methods). (b) Average (SE) response of the neurons in clusters 5 (red) and 12 (blue). Inset shows the average (SD) of response peak latency. (c) Distribution of looming- (LS; red) and dimming-sensitive (DS; blue) neurons in clusters 5 and 12, respectively. White dots show all neurons. (d) Regional distribution of all neurons in the LS (red) and DS (blue) clusters, regions are shown only if they contained at least 10 cells and were represented by at least 3 fish. (e) Key to the brain regions shown on the reference Z brain. (f) Distribution of putative GABAergic neurons (yellow) among all neurons (white). (g) Histogram of the coefficients of the exponential fit function to the peak response amplitudes of all neurons (see Methods). Full-width-half-max of a Gaussian fit to the near zero peak was used to determine positive (4.13 × 10⁻⁵ s−1) and negative (−1.17 × 10⁻⁵ s−1) thresholds. Maroon and green segments correspond to potentiating and depressing groups, respectively. (h) Median responses of depressing and potentiating LS cell subclusters to the first five dark looming stimuli. (i) Brain region stacked histogram of depressing (green), potentiating (maroon), and stable (white) LS cells. Inset: the proportion of GABAergic neurons (yellow) within each subcluster (border colors corresponding to depressing, potentiating, and stable subclusters, gray: non-GABAergic) (j, k). Same as (h, i) for DS cells.
|