
Figure 5
- ID
- ZDB-FIG-230315-19
- Publication
- Krug et al., 2023 - Generation of a transparent killifish line through multiplex CRISPR/Cas9-mediated gene inactivation
- Other Figures
- All Figure Page
- Back to All Figure Page
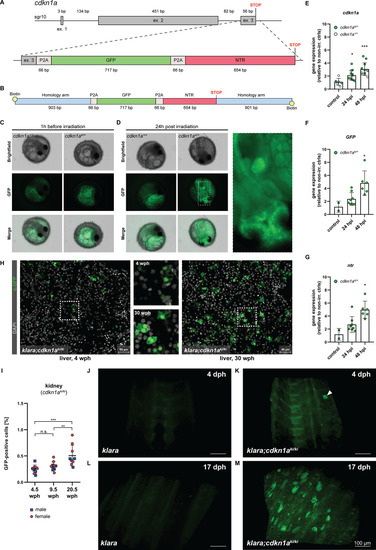
(A) The cdkn1a locus in klara was targeted via CRISPR/Cas9 to insert a reporter construct consisting of a GFP and an NTR cassette, separated by P2A self-cleavage sites, allowing the detection and ablation of senescent cells. (B) A 5’-biotinylated, double-stranded donor template flanked by two ~0.9 kb flanking arms was used for the target-specific insertion. (C,D) Function of the reporter construct was tested by exposing embryos (cdkn1a+/+ and cdkn1aki/+) to a γ-irradiation dose of 10 Gy. Representative images taken before irradiation showed autofluorescence originating from the yolk, which was observed in embryos of both genotypes (C). 24 hr post-irradiation (hpi), the presence of GFP-positive cells was detected only in cdkn1aki/+ embryos (D). (E) Gene expression analysis of cdkn1a in embryos (klara;cdkn1a+/+ and klara;cdkn1aki/+) at 24 (n=12) and 48 hpi (n=12) compared to non-irradiated controls (n=6). Expression of cdkn1a increased significantly as revealed by Student's t-test (p24hpi: 0.011, p48hpi: 0.0004). (F,G) For the expression of GFP (F) and ntr (G) at 24 (n=8) and 48 hpi (n=6) compared to non-irradiated controls (n=2), klara;cdkn1a+/+ embryos were excluded due to the absence of the reporter construct. Expressions of GFP and ntr were significantly increased at 48 hpi (pGFP: 0.045, pntr: 0.006) compared to controls. For all qRT-PCRs, rpl13a was used as a housekeeping gene. Relative gene expression was calculated using the ΔΔCT method. Student’s t-tests were computed to determine significant changes in gene expression. Error bars represent standard deviation. (H) Detection of GFP-positive cells in the liver of a young (4 wph) and an old (30 wph) klara;cdkn1aki/ki fish. A higher number of GFP+ cells was detected in the old liver sample. Images are displayed as extended depth of focus projections. In the young liver tissue, small individual GFP-positive cells were detected, whereas in the old liver, a high prevalence of enlarged GFP-positive cells was identified (see zoom-in). (I) Analysis of kidney samples via flow cytometry from klara;cdkn1aki/ki fish at the age of 4.5 wph (nmale = 5; nfemale = 4), 9.5 wph (nmale = 5; nfemale = 5) and 20.5 wph (nmale = 4; nfemale = 5). A significantly higher proportion of GFP-positive cells was detected in 20.5 wph versus 4.5 wph (p: 0.0009) and 9.5 wph (p: 0.0084) fish. One-Way ANOVA followed by Tukey’s post hoc test was computed to analyze for differences in cell number. Horizontal line shows mean value. Error bars represent standard deviation. (J–M) Representative images from light sheet microscopy show the presence of GFP-positive cells in living klara;cdkn1aki/ki fish (K, M) at 4 dph (K) and 17 dph (M). The panel displays representative 3D reconstructions from stacks of 31 (J,L) and 372 (K,M) optical slices. Klara fish at the same ages (J,L), which do not have any GFP + cells, were used as controls. The image processing settings for the klara fish were adjusted to make the background fluorescence visible in order to create comparable image pairs. While a high number of GFP-positive cells was present in the dorsal fin area of klara;cdkn1aki/ki fish at the age of 17 dph (M), only one cell (marked by the white arrowhead) was detected in the dorsal developing fin of the younger klara;cdkn1aki/ki animal (K).
|