
Fig. 2
- ID
- ZDB-FIG-230313-21
- Publication
- Wu et al., 2021 - Methylome inheritance and enhancer dememorization reset an epigenetic gate safeguarding embryonic programs
- Other Figures
- All Figure Page
- Back to All Figure Page
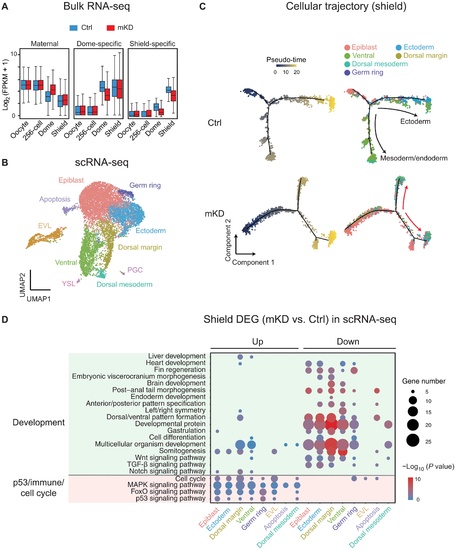
Bulk and scRNA-seq revealed developmental defects in mKD embryos.(A) Distribution of RNA levels of maternal genes (left), dome-specific genes (middle), and shield-specific genes (right) across different developmental stages of control (blue) and dnmt1 mKD (red) embryos. (B) Projection of cells with Uniform Manifold Approximation and Projection (UMAP) for control and dnmt1 mKD embryos at dome and shield stages. Cells are colored by clusters. (C) Pseudo-time trajectory of control and dnmt1 mKD embryos at shield stage. Cells were ordered from epiblast to ectoderm or mesoderm and endoderm and colored by pseudo-time (left) or clusters in (B) (right). Red arrows indicate abnormal cell differentiation branches. (D) Bubble plot showing enriched Gene Ontology (GO) terms for differentially expressed genes (DEGs) between control and dnmt1 mKD embryos of each cluster at shield stage. Top enriched terms include development and p53-dependent apoptosis, immune response, and cell cycle–related genes. Size of circle encodes gene number; color of the circle indicates −log10(P value). TGF-β, transforming growth factor–β; MAPK, mitogen-activated protein kinase. |