
- Title
-
Methylome inheritance and enhancer dememorization reset an epigenetic gate safeguarding embryonic programs
- Authors
- Wu, X., Zhang, H., Zhang, B., Zhang, Y., Wang, Q., Shen, W., Wu, X., Li, L., Xia, W., Nakamura, R., Liu, B., Liu, F., Takeda, H., Meng, A., Xie, W.
- Source
- Full text @ Sci Adv
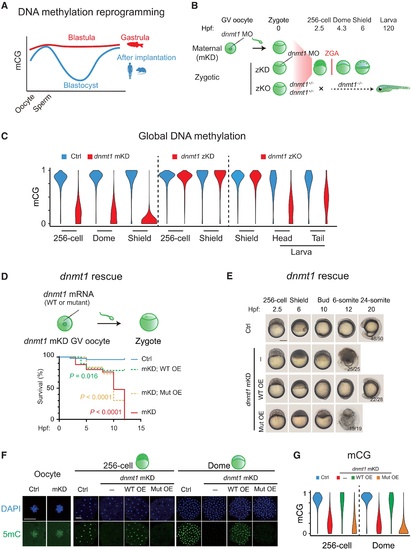
Maternal dnmt1 is essential for embryonic DNA methylation and development.(A) Schematic of DNA methylation landscapes in zebrafish (red) and mammals (blue) during early development. mCG, methylated CG. (B) Schematic of dnmt1 mKD via OMIS, zKD, and zKO. Three main developmental stages were examined in this study, including the 256-cell (pre-ZGA), dome, and shield (post-ZGA) stages. ZGA begins around 3 hpf. zKO embryos (dnmt1−/−) could survive until 120 hpf. (C) Violin plots showing average DNA methylation levels across the genome at different developmental stages of control (blue) and dnmt1 mKD embryos (red), zKD embryos (red), and zKO (red) embryos/larvae. (D) Survival curve of control (blue line), dnmt1 mKD embryos (red line), and dnmt1 mKD embryos rescued with either dnmt1 mismatch mRNAs [mKD; WT overexpressed embryos (WT OE), green dashed line] or catalytically mutant dnmt1 mismatch mRNAs (mKD; Mut OE, orange dashed line). Log-rank test was used to calculate P value. (E) Representative images of embryo phenotypes in control, dnmt1 mKD embryos, and dnmt1 mKD embryos rescued with either dnmt1 mismatch mRNAs (WT OE) or catalytically inactive mutant dnmt1 mismatch mRNAs (Mut OE) across different developmental stages. The numbers and ratios of embryos with a particular phenotype in each group are also shown. Scale bar, 250 μm. (F) Immunostaining of 5mC (green) in control and dnmt1 mKD oocytes, 256-cell, and dome embryos, as well as dnmt1 mKD embryos rescued by either dnmt1 mismatch mRNA (WT OE) or catalytically inactive mutant dnmt1 mismatch mRNA (Mut OE). DNA was stained with 4′,6-diamidino-2-phenylindole (DAPI) (blue). Scale bars, 50 μm. (G) Violin plot showing the global DNA methylation levels at the 256-cell and dome stages in control (Ctrl, blue), dnmt1 mKD (red), dnmt1 mismatch mRNA rescued (WT OE, green), and catalytically inactive mutant dnmt1 mismatch mRNA rescued embryos (Mut OE, yellow) |
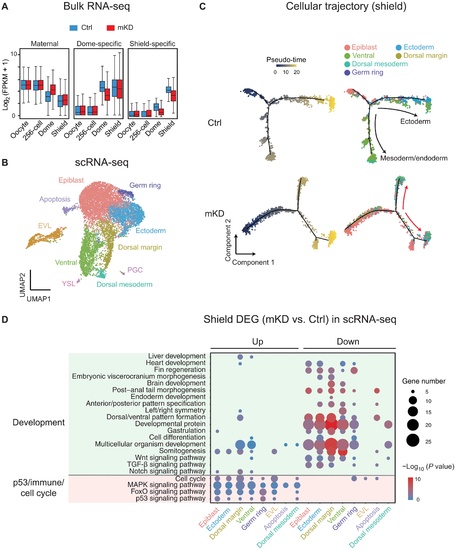
Bulk and scRNA-seq revealed developmental defects in mKD embryos.(A) Distribution of RNA levels of maternal genes (left), dome-specific genes (middle), and shield-specific genes (right) across different developmental stages of control (blue) and dnmt1 mKD (red) embryos. (B) Projection of cells with Uniform Manifold Approximation and Projection (UMAP) for control and dnmt1 mKD embryos at dome and shield stages. Cells are colored by clusters. (C) Pseudo-time trajectory of control and dnmt1 mKD embryos at shield stage. Cells were ordered from epiblast to ectoderm or mesoderm and endoderm and colored by pseudo-time (left) or clusters in (B) (right). Red arrows indicate abnormal cell differentiation branches. (D) Bubble plot showing enriched Gene Ontology (GO) terms for differentially expressed genes (DEGs) between control and dnmt1 mKD embryos of each cluster at shield stage. Top enriched terms include development and p53-dependent apoptosis, immune response, and cell cycle–related genes. Size of circle encodes gene number; color of the circle indicates −log10(P value). TGF-β, transforming growth factor–β; MAPK, mitogen-activated protein kinase. |
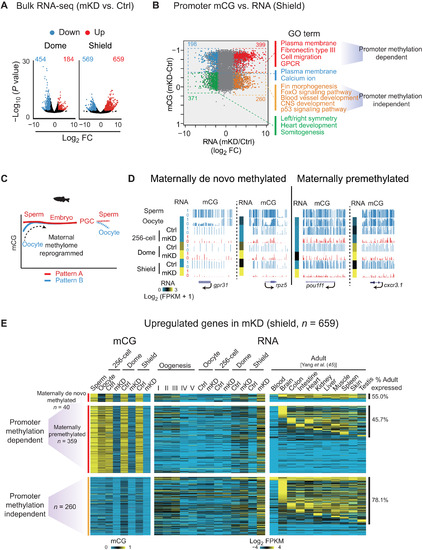
Promoter DNA methylation–dependent and –independent gene derepression in mKD embryos.(A) Volcano plots showing gene expression changes between control and dnmt1 mKD embryos at dome and shield stages. Red and blue dots indicate up-regulated and down-regulated genes, respectively. The numbers indicate counts of dysregulated genes. FC, fold change. (B) Scatter plots comparing alteration of gene expression and promoter mCG between control and dnmt1 mKD embryos at shield stage. Red and orange dots indicate promoter DNA methylation–dependent and –independent up-regulated genes, respectively; blue and green dots indicate down-regulated genes with decreased and constant promoter DNA methylation, respectively. The numbers of dysregulated genes and enriched GO terms in corresponding group (color coded) are also shown. GPCR, G protein–coupled receptor. (C) Schematic of DNA methylation reprogramming from gametes to the next generation in zebrafish. Sperm, early embryo, and PGC exhibit highly similar methylomes (pattern A) (27, 28). Oocyte has a distinct methylome (pattern B) that will be reprogrammed to pattern A after fertilization. (D) UCSC Genome Browser snapshots showing promoter mCG in sperm, oocyte, 256-cell, dome, and shield stage embryos for maternally de novo methylated [mCG(dome or shield − oocyte) > 0.4; mCG(oocyte < 0.4)] and maternally premethylated genes [mCG(dome or shield – oocyte) ≤ 0.4; mCG(oocyte ≥ 0.4)]. RNA of the 256-cell, dome, and shield stage embryos is also shown (heatmap). (E) Heatmaps showing promoter mCG and RNA expression of promoter DNA methylation–dependent or –independent genes in (B) of oogenesis, early embryos, and adult tissues (45). Promoter DNA methylation–dependent genes were further classified into maternally de novo methylated and maternally premethylated genes groups based on the mCG levels in oocyte and early embryos. The ratios of tissue expressed genes (FPKM > 5) in each group are also shown, and statistical significance for the enrichment was assessed with one-sided Fisher’s exact test. |
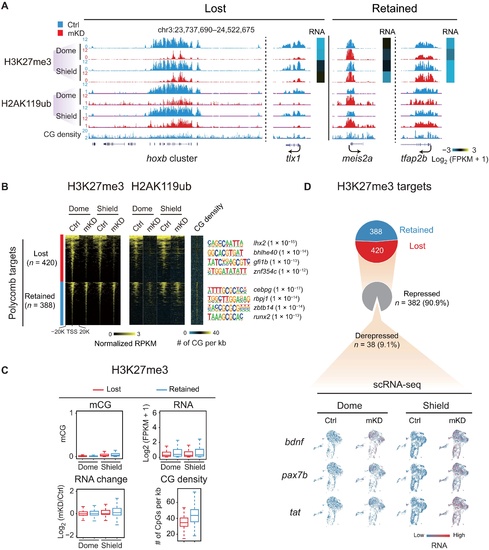
dnmt1 mKD results in defective Polycomb domain establishment.(A) UCSC Genome Browser snapshot showing H3K27me3 and H2AK119ub of control (blue) and dnmt1 mKD (red) embryos at dome and shield stages. Heatmap showing RNA expression of related genes. (B) Heatmaps showing the normalized H3K27me3 and H2AK119ub enrichment around promoters (TSS ± 20 kb) of Polycomb target in control (blue) and dnmt1 mKD (red) embryos at dome and shield stages. CG density and enriched TF motifs are shown too (right). (C) Box plots showing promoter mCG, RNA, and CG density levels for two clusters of Polycomb targets [lost (red) and retained (blue), defined in (B)] at dome and shield stages of control (top). RNA changes between control and dnmt1 mKD embryos (RNA change) are also shown (bottom left). (D) Pie chart showing the percentages of Polycomb target genes with lost or retained H3K27me3 in dnmt1 mKD embryos at shield stage and, among “lost” group genes, the percentages of genes that are derepressed [log2FC (mKD/Ctrl) > 2] and remain repressed (gray) (top). The feature plots of scRNA-seq show RNA expression of example derepressed genes in control and dnmt1 mKD embryos at dome and shield stages (bottom). Each dot indicates one cell. Red, high expression; blue, low expression. |
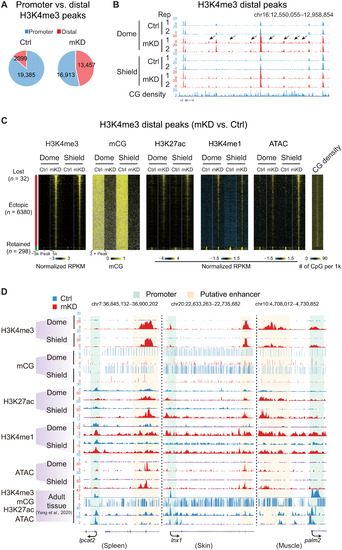
Loss of DNA methylation causes ectopic activation of putative adult enhancers and aberrant acquisition of distal H3K4me3 in early embryos.(A) Pie charts showing distributions of promoter (blue) and distal (red) H3K4me3 sites in control and mKD embryos at shield stage. (B) UCSC Genome Browser snapshot showing H3K4me3 at dome and shield stages of control (blue) and dnmt1 mKD (red) embryos, and CG density. Arrows indicate ectopic H3K4me3 sites. (C) Heatmaps showing distal H3K4me3, mCG, H3K27ac, H3K4me1, open chromatin (ATAC-seq), and CG density in either control or dnmt1 mKD embryos. Peaks were classified into three clusters based on the dynamics of distal H3K4me3: lost (H3K4me3 lost in dnmt1 mKD embryos, blue), ectopic (H3K4me3 acquired in dnmt1 mKD embryos, red), and retained (H3K4me3 present in both control and mKD, green). (D) UCSC Genome Browser snapshots showing H3K4me3, mCG, H3K27ac, H3K4me1, and open chromatin (ATAC-seq) at dome and shield stages of control (blue) and dnmt1 mKD (red) embryos and adult tissues (spleen, left; skin, middle; muscle, right) (45). Green shadow indicates promoter, and orange shadow indicates putative enhancer. |
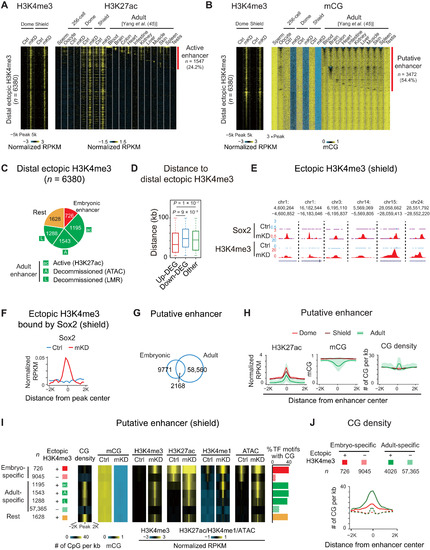
DNA methylation separates embryonic and adult programs through blocking high CG density adult enhancers.(A and B) Heatmaps showing H3K4me3, H3K27ac (A), and mCG (B) around distal ectopic H3K4me3 in embryos and adult tissues (45). Peaks with H3K27ac signals are defined as active enhancers (A) (red). LMRs are defined as putative enhancers (B) (red). (C) Pie chart showing distribution of distal ectopic H3K4me3 overlapping with embryonic (red), active adult (green; “ac”, distal H3K27ac), decommissioned adult (green; “A”, ATAC-seq; “L”, LMRs; without H3K27ac) enhancers, and the rest ectopic H3K4me3 sites (orange). (D) Box plot showing distance from center of distal ectopic H3K4me3 peaks to up-regulated (red), down-regulated (blue), and non-DEGs (green) at shield stage. (E and F) UCSC Genome Browser snapshots (E) and line chart (F) showing Sox2 binding and H3K4me3 (E) and Sox2 binding distribution around ectopic H3K4me3 acquiring Sox2 (F) in control (blue) and dnmt1 mKD (red) embryos. (G) Venn diagram showing overlap between embryonic (dome and shield) and adult tissues (45) enhancers. (H) Line charts showing H3K27ac, mCG, and CG densities in dome (red), shield (dark red) embryos, and adult tissues 45) (green; line, average value; shade, range of all tissues) around putative enhancers defined at each stage. (I) Heatmaps showing average CG density, mCG, H3K4me3, H3K27ac, H3K4me1, and ATAC-seq of putative enhancers. Classification of enhancer (left): red/crossed red, embryonic-specific enhancer with/without distal ectopic H3K4me3; green/crossed green, adult enhancers with [defined in (C)]/without distal ectopic H3K4me3; orange, the rest distal ectopic H3K4me3. Bar chart shows the ratios of enriched TF motifs (P < 1 × 10⁻²⁰) in putative enhancers containing CGs (right). (J) Line chart showing CG densities around embryonic specific enhancers with (red line)/without (red dashed line) distal ectopic H3K4me3, as well as adult enhancer with (green line)/without (green dashed line) distal ectopic H3K4me3. |
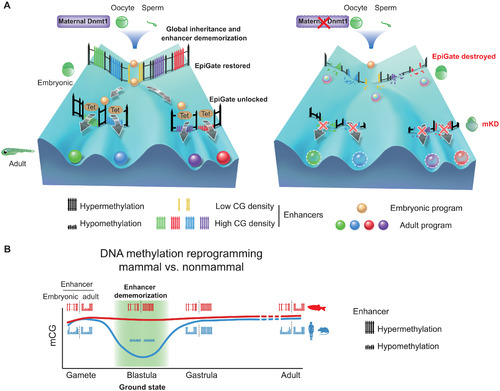
Inherited methylome coupled by enhancer dememorization resets an epigenetic gate that safeguards embryonic programs.(A) Maternal Dnmt1–mediated inherited global DNA methylome coupled with enhancer dememorization plays an instrumental role in restoring a full methylome to ultimately safeguard embryonic development against premature activation of adult programs. In WT embryos, inherited methylome sets up an EpiGate after fertilization and effectively repress adult enhancers, which are preferentially CG-rich. Embryonic enhancers, which are CG-poor, and insensitive to DNA methylation, can function while hypermethylated, and instruct embryonic transcription program. At the phylotypic stage, expression of tet genes demethylates CG-rich adult enhancers, allowing their activation and cell lineage differentiation. While in maternal dnmt1 mKD embryos, inherited DNA methylome failed to be maintained after fertilization, hence destroying the EpiGate. This leads to aberrant activation of adult programs in early embryos, accompanied by developmental failure and embryonic lethality around gastrulation. (B) Enhancer dememorization resets the developmental clock by restoring a ground-state (green shade) free of parental epigenetic memories in both mammals (blue, human and mouse) and nonmammalian vertebrate (red, zebrafish) around blastula stage. This epigenetic resetting is achieved through global DNA remethylation and demethylation in mammals and through enhancer hypermethylation in zebrafish. Embryonic enhancers are then demethylated in gastrula only in mammals, where TETs are expressed, but not in zebrafish, where TETs are still silenced. Zebrafish embryonic enhancers are nevertheless functioning presumably due to their low CG densities and insensitivity to DNA methylation. Adult enhancers are subsequently demethylated by TETs in both mammals and zebrafish. In mammals, embryonic enhancers also remain hypomethylated in adult tissues despite being decommissioned (11, 12). |