
Figure 3
- ID
- ZDB-FIG-230228-425
- Publication
- Sellaththurai et al., 2023 - CRISPR/Cas9-Induced Knockout of Sting Increases Susceptibility of Zebrafish to Bacterial Infection
- Other Figures
- All Figure Page
- Back to All Figure Page
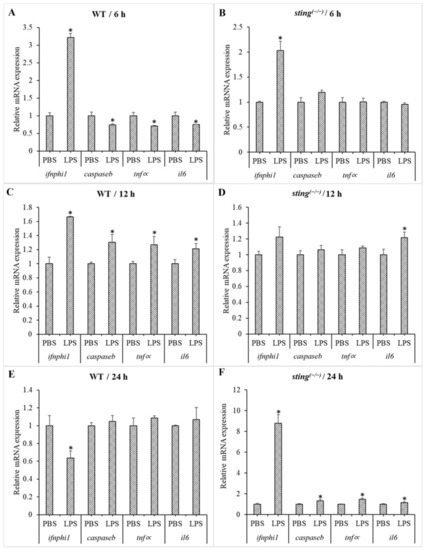
Comparison of gene expression in WT and sting(−/−) zebrafish larvae under LPS stimulation. The larvae samples were collected 6, 12, and 24 h post-LPS treatment of 3 dpf WT ((A,C,E) respectively) and sting(−/−) ((B,D,F) respectively) zebrafish larvae. Ef1∝ was used as an internal control to analyze the relative mRNA expression of genes downstream of sting using the Livak method. Transcription levels of target genes in the PBS-treated group were considered as 1, and expression levels in the LPS-treated groups were normalized to those in the PBS-treated group and are represented as fold values. Standard deviation (SD; n = 3) is indicated by the error bars. Significantly differentially transcribed genes (when compared to the respective PBS-treated control) are marked with an asterisk (*: p < 0.05). |