
- Title
-
CRISPR/Cas9-Induced Knockout of Sting Increases Susceptibility of Zebrafish to Bacterial Infection
- Authors
- Sellaththurai, S., Jung, S., Kim, M.J., Nadarajapillai, K., Ganeshalingam, S., Jeong, J.B., Lee, J.
- Source
- Full text @ Biomolecules
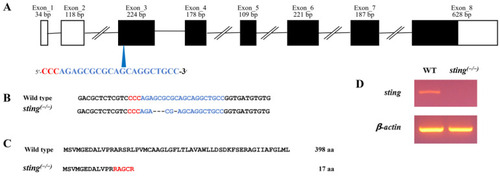
Generation of sting(−/−) zebrafish. (A) Schematic illustration of organization of zebrafish sting. The white and black boxes represent untranslated regions and open reading frames, respectively. The blue arrowhead indicates the single guide RNA (sgRNA) target site. The PAM and the sgRNA target sequences are indicated in red and blue letters, respectively. (B) The obtained mutation in sting(−/−) fish using CRISPR/Cas9 gene editing. Deleted nucleotides in the sting(−/−) genome are indicated with hyphens. (C) Amino acid prediction of Sting in the sting(−/− ) and WT zebrafish genomes. The altered amino acids are represented with red letters. (D) Confirmation of mutation via RT–PCR using sting(−/−) mutation-specific primers in 7 dpf larvae of sting(−/−) and WT zebrafish. |
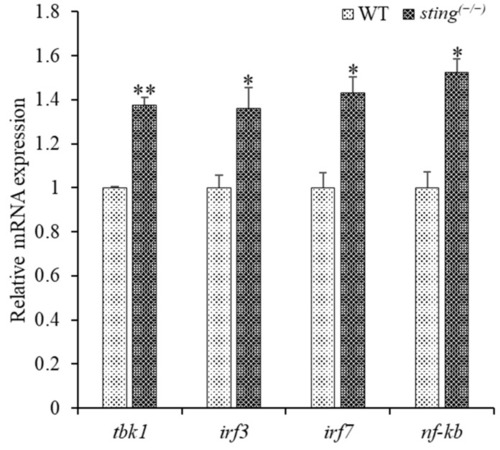
Comparison of transcription of downstream genes in 7 dpf larvae of sting(−/−) and WT zebrafish. The internal control gene, β-actin, was used to analyze the relative mRNA expression of genes downstream of sting using the Livak method. Experiments were performed in triplicate, and the error bar represents the standard deviation (SD). Student’s t-tests were used for statistical analysis, and p < 0.01 (indicated by *) and <0.001 (indicated by **) were considered statistically significant. |
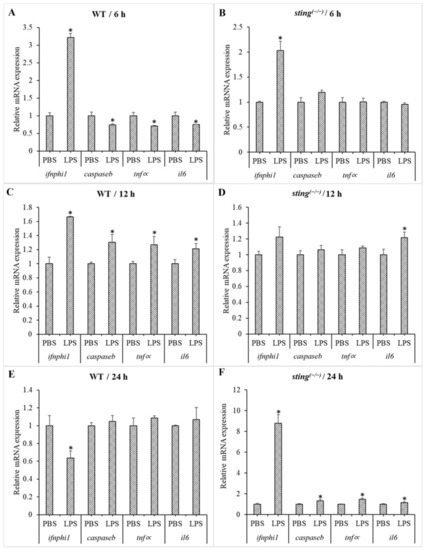
Comparison of gene expression in WT and sting(−/−) zebrafish larvae under LPS stimulation. The larvae samples were collected 6, 12, and 24 h post-LPS treatment of 3 dpf WT ((A,C,E) respectively) and sting(−/−) ((B,D,F) respectively) zebrafish larvae. Ef1∝ was used as an internal control to analyze the relative mRNA expression of genes downstream of sting using the Livak method. Transcription levels of target genes in the PBS-treated group were considered as 1, and expression levels in the LPS-treated groups were normalized to those in the PBS-treated group and are represented as fold values. Standard deviation (SD; n = 3) is indicated by the error bars. Significantly differentially transcribed genes (when compared to the respective PBS-treated control) are marked with an asterisk (*: p < 0.05). |
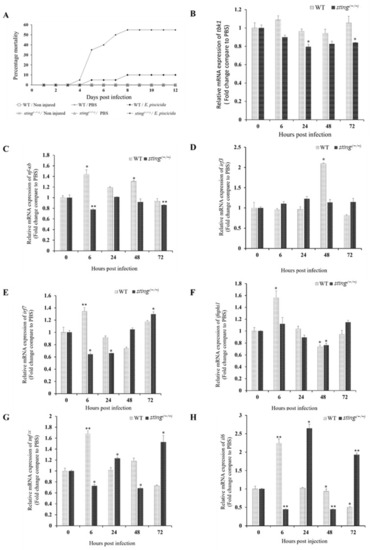
E. piscicida challenge in sting(−/−) and WT zebrafish. (A) Percent mortality of sting(−/−) and WT zebrafish post-E. piscicida infection. Two-month-old juvenile zebrafish were wounded, and E. piscicida infection was performed via bath immersion for 5 h. (B–H) Temporal transcription of tbk1, nf-κb, irf3, irf7, ifnphi1, tnfα, and il6 in juvenile sting(−/−) and WT zebrafish upon E. piscicida infection. ef-1α expression was used as an internal control to analyze relative mRNA expression using the Livak method, and gene expression was normalized to that of the respective PBS control group. The error bars and the asterisk (* p < 0.01, ** p < 0.001) indicate the standard deviation and significantly different transcription levels compared to the respective control, respectively. |