
Fig. 2
- ID
- ZDB-FIG-230228-418
- Publication
- Kamimoto et al., 2023 - Dissecting cell identity via network inference and in silico gene perturbation
- Other Figures
- All Figure Page
- Back to All Figure Page
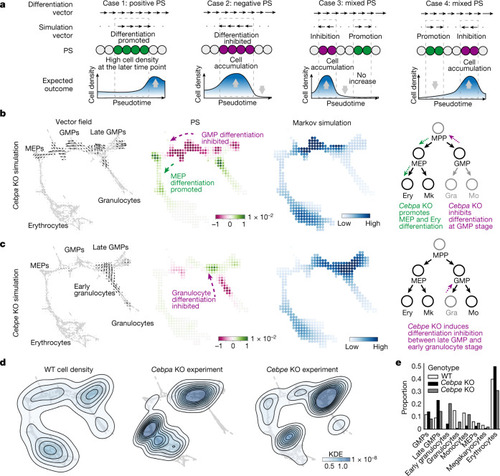
Validation of CellOracle using experimentally measured cell density in Cebpa and Cebpe KOs in haematopoiesis.
a, Biological interpretation of perturbation scores (estimation of cell density based on perturbation score). Case 1: the differentiation and perturbation simulation vectors share the same direction, indicating a population shift towards a more differentiated identity. Case 2: the two vectors are opposed, suggesting that differentiation is inhibited. Case 3: predicted inhibition precedes promotion; thus, cells will be likely to accumulate. b,c, CellOracle Cebpa KO (b) and Cebpe KO (c) simulations showing cell-state transition vectors, perturbation scores and estimated cell density (Markov simulation). Right, schematics of simulated phenotype. Ery, erythrocyte. d, Ground-truth experimental cell density plot of wild-type (WT) cells, Cebpa KO cells and Cebpe KO cells in the force-directed graph embedding space. Estimated kernel density data are shown as a contour line on a scatter plot to depict cell density. e, Cell-type proportions in the WT and ground-truth KO samples. Gra, granulocyte; KDE, kernel density estimation; Mo, monocyte. |