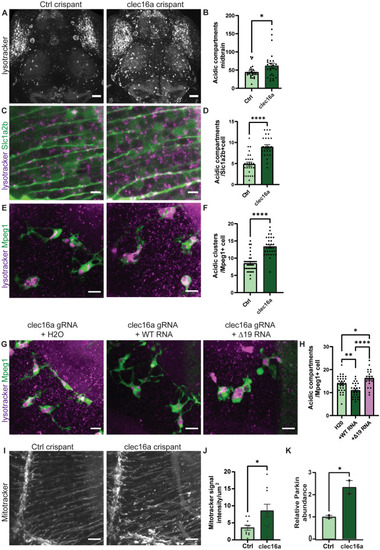
Quantification of autophagy and mitophagy in clec16a crispants. a Acidic compartments stained with LysoTracker in the clec16a crispants and control injected embryos at 5dpf. Scale bars indicate 50 µm. b Quantification of acidic compartments > 5 µm in the optic tectae of the clec16a crispants brain quantified. Unpaired t test with Welch’s correction (n = 2 experiments, n = 25 fish per group). c LysoTracker staining (magenta) in slc1a2b:Citrine background (green), visualizing radial glia. Scale bars indicate 5 µm (number of fish: n = 12; clec16a crispants n = 13, 2–3 cells per brain were counted, N = 2 experiments). d Quantification of c, unpaired t test with Welch’s correction. e LysoTracker staining (magenta) in mpeg1:GFP background (green), visualizing microglia (n = 11 fish for both groups, 3–4 cells per brain were counted, N = 2 experiments). Scale bars indicate 10 µm. f Quantification of e, Mann–Whitney U test. g, h Single-cell embryos were simultaneously injected with a crRNA targeting clec16a + CLEC16A-WT or CLEC16A-Δ19 mRNA or H2O (number of fish: CLEC16A-WT n = 12, CLEC16A-Δ19 n = 12, H2O n = 11, 2–3 cells per brain were counted, N = 2 experiments). Scale bars indicate 10 µm, one-way Anova. i MitoTracker staining of the right hemisphere midbrain region. j Quantification of i, total high MitoTracker intensity area was quantified in the radial fibers. Scale bars indicate 10 µm (n = 10 fish for both groups, N = 2 experiments, unpaired t test with Welch’s correction). k Intensities of the Parkin protein band were quantified from immunoblot (Supplementary Fig. 7a) and corrected for total protein (Supplementary Fig. 7b). The average relative Parkin abundance of the two control samples was set as a relative abundance of 1 (unpaired t test). *p < 0.05, **p < 0.01, ****p < 0.0001