
Fig. 3
- ID
- ZDB-FIG-230228-414
- Publication
- Smits et al., 2022 - CLEC16A interacts with retromer and TRIM27, and its loss impairs endosomal trafficking and neurodevelopment
- Other Figures
- All Figure Page
- Back to All Figure Page
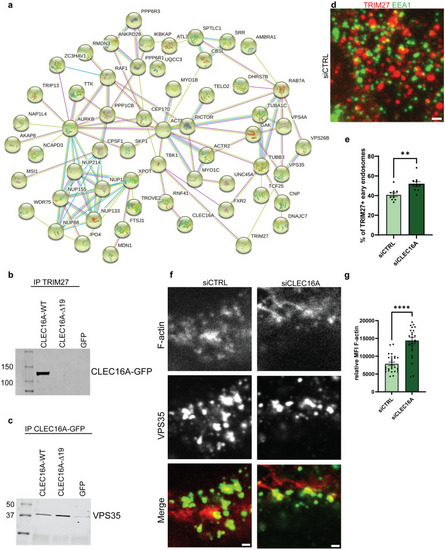
CLEC16A interactome and endosomal F-actin levels. a HEK293T cells were transfected with pEGFP-CLEC16A-WT, pEGFP-CLEC16A-Δ19, or negative control GFP-C1 for 48 h, followed by immunoprecipitation with anti-rabbit GFP antibodies and LC–MS/MS (n = 2 for all groups). Proteins interacting with pEGFP-CLEC16A-WT or pEGFP-CLEC16A-Δ19 but not with GFP-C1 were filtered based on their Andromeda score (> 40). Panel a shows the most significant network, which is related to the retromer complex. The colors of the lines indicate the stringency of the interaction. Light blue: from curated databases, pink: experimentally determined, green: gene neighborhood, red: gene fusions, dark blue: gene co-occurrence, yellow: text miming, black: co-expression, purple: protein homology. b The interaction between pEGFP-CLEC16A-WT/Δ19 was confirmed after reciprocal IP with anti-TRIM antibodies 48 h after overexpression with pEGFP-CLEC16A-WT, pEGFP-CLEC16A-Δ19, or GFP. All plasmids were revealed on immunoblot with anti-GFP antibodies. c The binding of pEGFP-CLEC16A-WT and Δ19 to the retromer component VPS35 was confirmed on immunoblot 48 h after transfection with pEGFP-CLEC16A-WT, pEGFP-CLEC16A-Δ19, or GFP, followed by immunoprecipitation. d Immunostainings on HEK293T cells treated with siCTRL or siCLEC16A siRNAs 48 h after transfection. Cells were stained with antibodies against EEA1 (green) and TRIM27 (red). e Quantification of d, unpaired t test with Welch’s correction (n = 2 experiments; n = 12–15 fields/section, > 150 endosomes per field counted). f Immunostainings on HEK293T cells treated with siCTRL or siCLEC16A siRNAs 72 h after transfection. Cells were stained with antibodies against TRIM27 (green) and phalloidin-alexa 647 (red). g Quantification of f, unpaired t test with Welch’s correction (n = 3 experiments, n = 10 fields/section, 3–5 regions per field analyzed). All scale bars in this Fig. represent 1 µm. **p < 0.01, ****p < 0.0001 |