
Fig. 1
- ID
- ZDB-FIG-230226-1
- Publication
- Slováková et al., 2022 - Tension-dependent stabilization of E-cadherin limits cell-cell contact expansion in zebrafish germ-layer progenitor cells
- Other Figures
- All Figure Page
- Back to All Figure Page
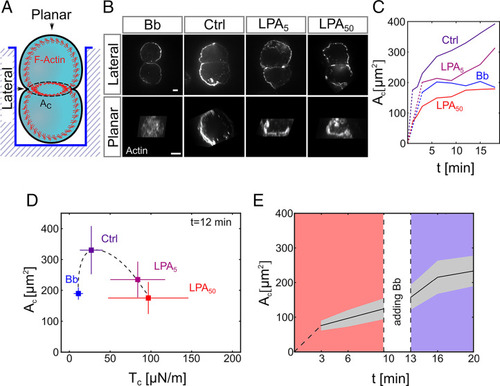
Cortical tension limits contact expansion in cell doublets. (A) Schematic of the experimental setup for live imaging of progenitor cell doublets. Doublets were placed in polymeric wells for maintaining their contact within the focal plane while being imaged from the bottom. (B) Planar and lateral views of the actin cell cortex in progenitor cell doublets (10-min contact time) visualized by Phalloidin (F-actin) in control (Ctrl) doublets and doublets exposed to Bb (10 μM) or LPA (5 and 50 nM). (Scale bar: 5 μm.) (C) Cell–cell contact size (Ac) as a function of contact time in control doublets, doublets exposed to Bb (10 μM), or different concentrations of LPA (1 to 50 nM). Dotted lines connect contact formation (0 min) with the first time point when data were collected. Error bars (SD) are shown in SI Appendix, Fig. S1. Ctrl: N = 9, n = (1 min: 30, 2 min: 26, 3 min: 30, 6 min: 24, 9 min: 24, 12 min: 24, 15 min: 22, 18 min: 22); LPA5: N = 1, n = 10 (for each time point); Bb: n = 1, n = (3 for each time point); LPA50: N = 7, n = (1 min: 32, 2 min: 32, 3 min: 33, 6 min: 21, 9 min: 21, 12 min: 21, 15 min: 21, 18 min: 20). (D) Cell–cell contact size (Ac) at 12-min contact time for control doublets and doublets exposed to Bb (10 μM) or different amounts of LPA (5 to 50 nM) plotted against cortical tension (Tc) values measured by AFM. Error bars denote SD. For Tc measurements, N = 3, (single-cell Ctrl) n = 287, (single-cell Bb) n = 88, (single-cell LPA5) n =142, and (single-cell LPA50) n = 294. For Ac measurements, N and n are the same as in C (time point 12 min). (E) Ac in doublets exposed to 50 nM LPA as a function of time in culture before and after adding 10 μM Bb to the culture medium. The gray area denotes SD (N = 3; n = 16). If not stated otherwise, N corresponds to the number of experiments, and n corresponds to the number of cell doublets. |