
Fig. 5
- ID
- ZDB-FIG-230213-5
- Publication
- Chiang et al., 2023 - HyU: Hybrid Unmixing for longitudinal in vivo imaging of low signal-to-noise fluorescence
- Other Figures
- All Figure Page
- Back to All Figure Page
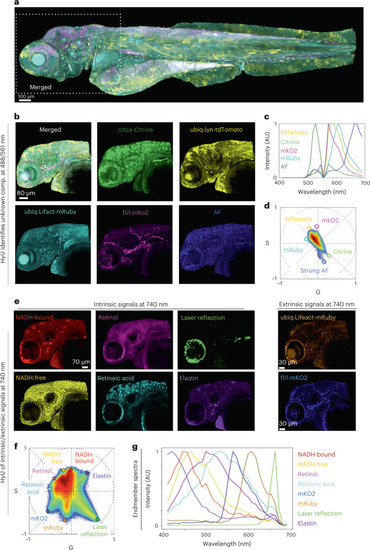
HyU enables identification and unmixing of low-photon intrinsic signals in conjunction with extrinsic signals.
a, HyU results of a quadra-transgenic zebrafish Gt(cltca-citrine);Tg(ubiq:lyn-tdTomato;ubiq:Lifeact-mRuby;fli1:mKO2) imaged over multiple tiles. b, HyU results of the head region (box in a). Scale bar, 80 µm. AF, autofluorescence. c,d, The input spectra (c) required to perform the unmixing are easily identified on the phasor plot (d) when visualizing each spectrum as a spatial location. AU, arbitrary units. e, The zoomed-in acquisition of the head region of the embryo (box in a) after application of HyU. Scale bar, 70 µm. f, Phasor plot representation of eight independent fluorescent fingerprint locations. g, The spectra corresponding to each of the eight independent spectral components are also provided as reference. Colors in f match renderings in e and g: NADH-bound (red), NADH-free (yellow), retinoid (magenta), retinoic acid (cyan), reflection (green), elastin (purple) and extrinsic signals, mKO2 (blue) and mRuby (orange). All signals were excited with a single-photon laser (a–d) at both 488 nm and 561 nm or a two-photon laser (e–g) at 740 nm. The sample depicted is representative of 28 (for a,b) and 24 (for e) experimental sessions each with three to five biological replicates, yielding similar results. |