
- Title
-
HyU: Hybrid Unmixing for longitudinal in vivo imaging of low signal-to-noise fluorescence
- Authors
- Chiang, H.J., Koo, D.E.S., Kitano, M., Burkitt, S., Unruh, J.R., Zavaleta, C., Trinh, L.A., Fraser, S.E., Cutrale, F.
- Source
- Full text @ Nat. Methods

Schematic illustrating how HyU enhances analysis of multiplexed hyperspectral fluorescent signals in vivo.
a, Multicolor fluorescent biological sample (here a zebrafish embryo) is imaged in hyperspectral mode, collecting the fluorescence spectrum of each voxel in the specimen. b, HyU represents spectral data as a phasor plot, a 2D histogram of the real and imaginary Fourier components (at a single harmonic). c, Spectral denoising filters reduce the Poisson and instrumental noise on the phasor histogram, providing the first signal improvement. d–f, The phasor acts as an encoder, where each histogram bin corresponds to a number n of pixels, each with a relatively similar spectrum (e). Summing these spectra effectively averages the spectra for that phasor position. This denoising results in cleaner average spectrum for this set of pixels, which are ideally suited for analytical decomposition through unmixing algorithms (f). g, Unmixing results in images that separated into spectral components. Here, LU is used for unmixing, but HyU is compatible with any unmixing algorithm. |

HyU outperforms standard LU in both synthetic and live spectral fluorescence imaging.
a,b, HyU (a) and LU (b) tested using a hyperspectral fluorescence simulation that was generated from four fluorescent signatures (emission spectra; Supplementary Fig. 5e). c, Absolute MSE shows that HyU offers a consistent reduction in error across a broad range of photons per spectra (no. photons per independent spectral components, here resulting from four reference spectra combined). Shaded regions for line plots denote the 95% confidence interval around the mean. d, The performance differences in the MSE of HyU relative to LU persists when applying multiple phasor denoising filters (0–5 median filters). Shaded regions for line plots denote the 95% confidence interval around the mean. e, Unmixing of experimental data from a four-color zebrafish shows increased contrast for HyU (left) compared to LU (right). Scale bar, 50 µm. f,g, The increased accuracy is revealed by residual images of HyU and LU, showing the spatial distribution of unassigned signals after the analysis of data in e. h, Box plots of the residuals (shown in f,g) presents values of 11% for HyU compared to 77% for LU with *(P < 10−10) with an independent two-sample t-test and n = 1.05 × 106 pixels. Center shows median; box represents first and third quartiles; whiskers represent 1.5× first and third quartiles; min/max are not shown. i–p, Enlarged rendering of HyU results (e, white box) clearly shows low levels of bleed-through between labels (m–p). Similar enlargement of LU results show noticeably worse performance. Note that regions with bright signals (membrane j,n, white arrow) bleed through other channels (m,o). Scale bar, 20 µm. Tetra-labeled specimen used here was Gt(cltca-citrine);Tg(ubiq:lyn-tdTomato; ubiq:Lifeact-mRuby;fli1:mKO2). The sample depicted in e is representative of 28 experimental sessions each with three to five biological replicates, yielding similar results. |

HyU enhances unmixing for low-signal in vivo multiplexing and achieves deeper volumetric imaging.
a,b, HyU volumetric renderings (a) compared to those of LU (b) for the trunk portion in a four-color zebrafish. The four labels in the fish are Gt(cltca-citrine);Tg(ubiq:lyn-tdTomato;ubiq:Lifeact-mRuby;fli1:mKO2), respectively labeling clathrin-coated pits (green), membrane (yellow), actin (cyan) and endothelial (magenta). c–f, Zoom-in views of insets from a and b. Scale bar, 20 µm. g,h, Intensity line plots of each of the four results signals for HyU (solid) and LU (dashed) demonstrate the improved profiles with greatly reduced noise peaks in HyU as compared to LU. Intensities are scaled by the maximum of each unmixed channel. DL, digital level. i, Box plots of the relative residual values as a function of z depth for HyU and LU highlight the improvements in the unmixing results. HyU has an unmixing residual of 6.6 ± 5.3% compared to that of LU at 58 ± 17%. The average amount of residual is ninefold lower in HyU with narrower variance of residual. An independent two-sample t-test was used with n = 5.2 × 105 pixels for each z slice. Center shows median; box shows first and third quartile; whiskers show 1.5× first and third quartiles; min/max are not shown. The sample depicted is representative of 28 experimental sessions each with three to five biological replicates, yielding similar results. |

HyU reveals the dynamics of developing vasculature by enabling multiplexed volumetric timelapse.
a, HyU rendering for the trunk portion of a three-color zebrafish Gt(cltca-citrine);Tg(kdrl:mCherry;fli1:mKO2) at time point 0. b, HyU unmixed results allow for quantitative analysis and segmentation, here an example representing the time evolution of the segmented volumes of mCherry (vasculature, magenta), mKO2 (endothelial lymphatics, yellow) and citrine (clathrin-coated pits, cyan). Box and line plots were generated using ImarisVantage as described in Methods. n = 8.38 × 10⁴ surface objects. Center shows median; box represents the first and third quartiles; and whiskers represent the minimum and maximum. Shaded regions for line plots denote the interquartile range around the median. c, Timelapse imaging of the formation of the vasculature over 300 min (zoomed-in rendering of the box in a) at 0 (i), 100 (ii), 200 (iii) and 300 min (iv). The sample depicted is representative of ten experimental sessions each with two to three biological replicates, yielding similar results. |
HyU enables identification and unmixing of low-photon intrinsic signals in conjunction with extrinsic signals.
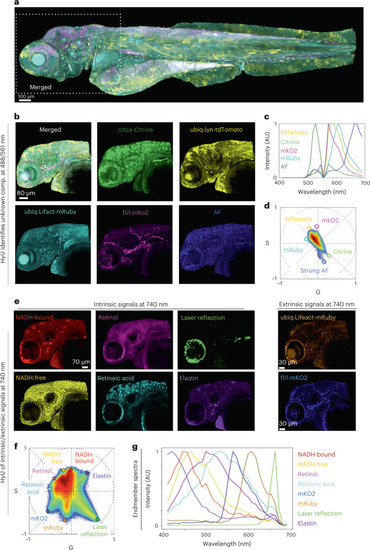
a, HyU results of a quadra-transgenic zebrafish Gt(cltca-citrine);Tg(ubiq:lyn-tdTomato;ubiq:Lifeact-mRuby;fli1:mKO2) imaged over multiple tiles. b, HyU results of the head region (box in a). Scale bar, 80 µm. AF, autofluorescence. c,d, The input spectra (c) required to perform the unmixing are easily identified on the phasor plot (d) when visualizing each spectrum as a spatial location. AU, arbitrary units. e, The zoomed-in acquisition of the head region of the embryo (box in a) after application of HyU. Scale bar, 70 µm. f, Phasor plot representation of eight independent fluorescent fingerprint locations. g, The spectra corresponding to each of the eight independent spectral components are also provided as reference. Colors in f match renderings in e and g: NADH-bound (red), NADH-free (yellow), retinoid (magenta), retinoic acid (cyan), reflection (green), elastin (purple) and extrinsic signals, mKO2 (blue) and mRuby (orange). All signals were excited with a single-photon laser (a–d) at both 488 nm and 561 nm or a two-photon laser (e–g) at 740 nm. The sample depicted is representative of 28 (for a,b) and 24 (for e) experimental sessions each with three to five biological replicates, yielding similar results. |
HyU pushes the upper limits of live multiplexed volumetric timelapse imaging of intrinsic and extrinsic signals.
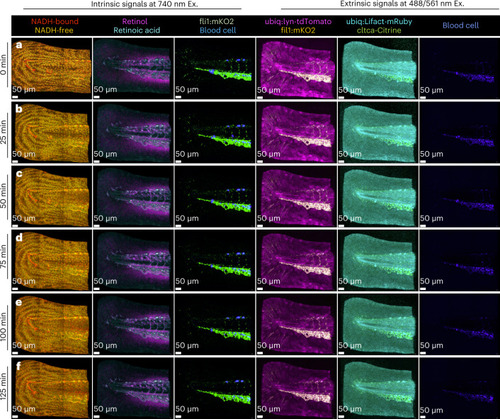
HyU’s increased sensitivity provides a simple solution for the challenging task of imaging timelapse data at six time points (125 min) for both intrinsic signals and extrinsic signals of a quadra-transgenic zebrafish: Gt(cltca-citrine);Tg(ubiq:lyn-tdTomato;ubiq:Lifeact-mRuby;fli1:mKO2). a–f, Volumetric renderings of HyU results for time points acquired at 25 min intervals reveal the high-contrast and high-multiplexed labels of NADH-bound (red), NADH-free (yellow), retinoid (magenta), retinoic acid (cyan), mKO2 (green) and AF from blood cells (blue) when excited at 740 nm. Further extrinsic signals for mKO2 (yellow), tdTomato (magenta), mRuby (cyan), citrine (green) and blood cells AF (blue) are also readily unmixed using HyU when exciting the sample at 488/561 nm. HyU provides the capacity to simultaneously multiplex nine signals in a live sample over long periods of time, a previously unexplored task. Scale bars, 50 µm. The sample depicted is representative of 28 experimental sessions each with three to five biological replicates, yielding similar results. |