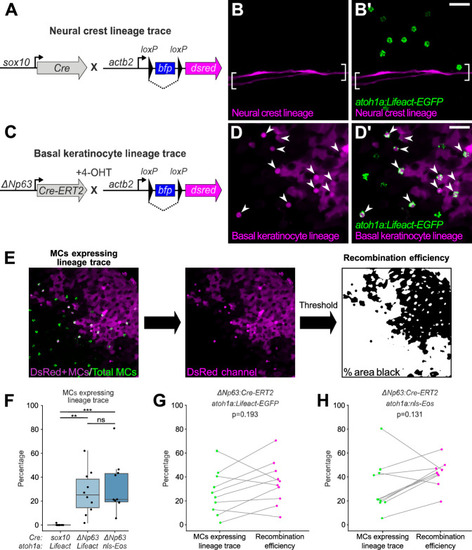
(A) Schematic of Cre-based neural crest lineage tracing strategy. (B) Confocal micrograph of the scale epidermis in an adult expressing neural crest lineage (Tg(sox10:Cre); Tg(actb2:LOXP-BFP-LOXP-DsRed)) and MC (Tg(atoh1a:Lifeact-EGFP)) reporters. Brackets denote Schwann cells associated with a nerve along a scale radius. (C) Schematic of Cre-based basal keratinocyte lineage tracing strategy. (D) Confocal micrograph of the scale epidermis in an adult expressing basal keratinocyte lineage (TgBAC(ΔNp63:Cre-ERT2); Tg(actb2:LOXP-BFP-LOXP-DsRed)) and MC (Tg(atoh1a:Lifeact-EGFP)) reporters, which was treated with 4-hydroxytamoxifen (4-OHT) at 1 day post-fertilization (dpf). Arrowheads indicate MCs labeled by the basal keratinocyte lineage reporter. Note that recombination is not complete, possibly explaining why not all MCs express the lineage reporter. (E) Workflow to calculate percentage of MCs expressing lineage reporter and percentage of total cells expressing lineage reporter. (F) Boxplots of the percentage of MCs expressing the lineage tracing reporters diagrammed in panels A and C. Each dot represents an individual scale. Overall percentage of MCs expressing lineage trace reporters: sox10/Lifeact, 0.3% (1/323 cells; N=6 adults, 27.5–31 mm standard length [SL]); ΔNp63/Lifeact, 29.7% (299/1005 cells; N=6 adults, 21–26 mm SL); ΔNp63/nls-Eos, 32.3% (386/1195 cells; N=4 adults, 20–30 mm SL). A one-way ANOVA (F=12.06; p<0.001) with Tukey’s post-hoc honestly significant difference (HSD) test was used to compare groups. **, p<0.01; ***, p<0.001. (G and H) Paired dot plots of the percentage of MCs expressing the indicated atoh1a reporter and the basal keratinocyte lineage reporter compared to the percentage of all cells in the field of view expressing DsRed. Statistical analyses were performed using the Wilcoxon test. Scale bars: 20 µm.