
- Title
-
Dermal appendage-dependent patterning of zebrafish atoh1a+ Merkel cells
- Authors
- Brown, T.L., Horton, E.C., Craig, E.W., Goo, C.E.A., Black, E.C., Hewitt, M.N., Yee, N.G., Fan, E.T., Raible, D.W., Rasmussen, J.P.
- Source
- Full text @ Elife
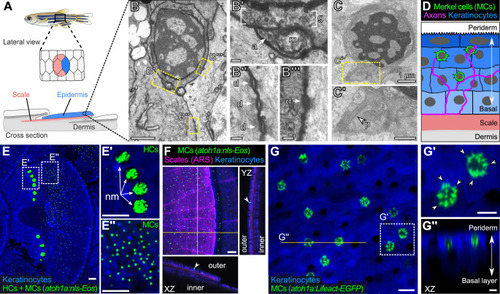
(A) Illustration of the adult zebrafish trunk anatomy showing the organization of epidermis, scales, and dermis. Scales are flat bony discs arranged in an overlapping, imbricated pattern and coated on their external surface by epidermis. (B) Transmission electron microscopy (TEM) of a presumptive MC from the scale epidermis. Dotted boxes indicate regions of magnification in B’–B’’’. (B’) Magnification of B showing cytoplasmic granules (g, brackets) juxtaposed to a putative axon (a) contact containing a mitochondrion (m). (B’’ and B’’’) Magnifications of B showing desmosomal-like (d, arrows) attachments between keratinocytes (B’’) and between a presumptive MC and keratinocyte (B’’’). (C and C’) TEM of a presumptive MC from the scale epidermis showing a microvillar process (p, arrowhead). (D) Illustration of a cross section of the scale epidermis based on TEM observations. Periderm cells (superficial epidermis; dark blue) are located in the uppermost epidermal stratum, and basal keratinocytes (light blue) are located in the lowermost epidermal stratum. MCs containing cytoplasmic granules, extending microvillar processes, and contacting axons localize between keratinocytes. (E) Lateral confocal micrograph of the trunk epidermis in an adult expressing reporters for keratinocytes (Tg(actb2:LOXP-BFP-LOXP-DsRed)) and atoh1a-expressing cells (Tg(atoh1a:nls-Eos)). Dotted boxes indicate areas of magnification in E’ and E’’. (E’) Magnification of E showing atoh1a+ hair cells (HCs) and progenitors within neuromasts (nm) of the posterior lateral line. (E’’) Magnification of E showing atoh1a+ MCs scattered throughout the scale epidermis. (F) Lateral and reconstructed cross sectional confocal micrographs of the trunk in an adult expressing reporters for keratinocytes (Tg(actb2:LOXP-BFP-LOXP-DsRed)) and atoh1a-expressing cells (Tg(atoh1a:nls-Eos)) and stained with Alizarin Red S (ARS) to label the mineralized scale matrix. Note that atoh1a+ MCs localize to the epidermis above scales (arrowhead). (G) Lateral confocal micrograph of the scale epidermis in an adult expressing reporters for keratinocytes (Tg(krt4:DsRed)) and F-actin within atoh1a+ MCs (Tg(atoh1a:Lifeact-EGFP)). Note that all atoh1a+ MCs extend multiple microvilli. (G’) Magnification of G with arrowheads indicating individual microvillar processes on the surface of MCs. (G’’) Reconstructed cross section along the yellow line in G. MCs localize to the upper epidermal strata as diagrammed in D. Note that Tg(krt4:DsRed) (blue) preferentially labels keratinocytes in the upper epidermal strata, but not in the basal cell layer. Scale bars: 1 µm (B and C), 0.1 µm (B’–B’’’), 0.5 µm (C’), 50 µm (E–E’’ and F), 10 µm (G), and 5 µm (G’ and G’’).
|
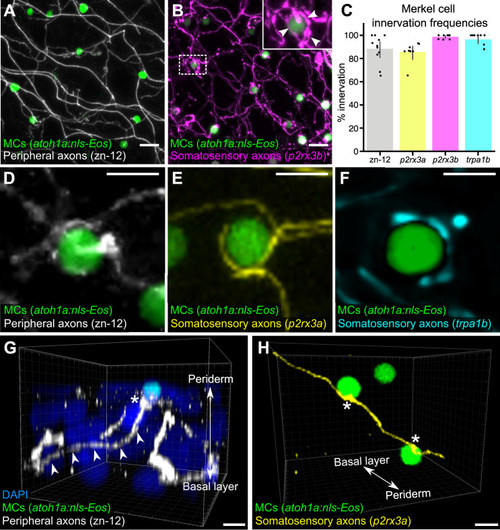
(A) Lateral confocal micrograph of the scale epidermis from an adult expressing an MC reporter immunostained for peripheral axons (zn-12). (B) Lateral confocal micrograph of the scale epidermis showing that somatosensory peripheral axons (Tg(p2rx3b:EGFP)) innervate MCs. Inset of dotted region shows axonal varicosities adjacent to an MC (arrowheads). (C) Quantification of MC innervation in the scale epidermis (17–30 mm standard length [SL]). Each dot represents measurements from an individual scale. Innervation frequencies: zn-12, 91% (284/311 cells; N=3 adults); Tg(p2rx3a>mCherry), 86% (196/228 cells; N=4 adults); Tg(p2rx3b:EGFP), 99% (225/228 cells; N=4 adults); Tg(trpa1b:EGFP), 96% (217/225 cells; N=9 adults). Error bars represent 95% CIs. (D–F) High-magnification confocal micrographs showing examples of somatosensory axons forming extended, ring-like contacts with MCs within the scale epidermis. (G) Three-dimensional (3D) reconstruction of an axon (zn-12 immunostaining, arrowheads) forming a bouton-like ending (asterisk) that terminates in close proximity to an MC. DAPI staining labels epidermal nuclei. (H) 3D reconstruction of a single somatosensory axon (Tg(p2rx3a>mCherry)) that forms en passant-like contacts (asterisks) with multiple MCs. Scale bars: 10 μm (A and B), 5 μm (D–H).
|
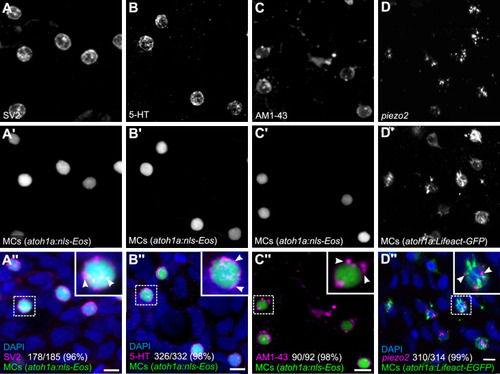
(A and B) Anti-SV2 (A–A’’) or anti-5-hydroxytryptamine (5-HT) (B–B’’) immunostaining of the scale epidermis from an adult expressing an MC reporter. Insets of dotted regions show the punctate localization of SV2 and 5-HT staining in MCs (arrowheads), consistent with a vesicular localization. 96% of MCs (178/185) were SV2+. 98% of MCs (326/332) were 5-HT+. Cells analyzed from n=3 scales from N=2 adults (25–27 mm standard length [SL]). DAPI labels epidermal nuclei. (C) Scale epidermis from an adult expressing an MC reporter stained with AM1-43. 98% of MCs (90/92) were AM1-43+. Cells analyzed from n=6 scales from N=2 adults. Inset of dotted region shows puncta within an MC labeled by AM1-43 (arrowheads). AM1-43 has been reported to stain neurites innervating MCs in murine whisker vibrissae (Meyers et al., 2003). However, our AM1-43 staining regimen did not strongly label cutaneous axons, although we cannot exclude low levels of staining. (D) Scale epidermis from an adult expressing an MC reporter stained with hybridization chain reaction (HCR) probes against piezo2 and an anti-GFP antibody. 99% of MCs (310/314) were piezo2+. Cells analyzed from n=7 scales from N=2 adults. Arrowheads indicate examples of positive staining within an MC. Scale bars: 5µm.
|
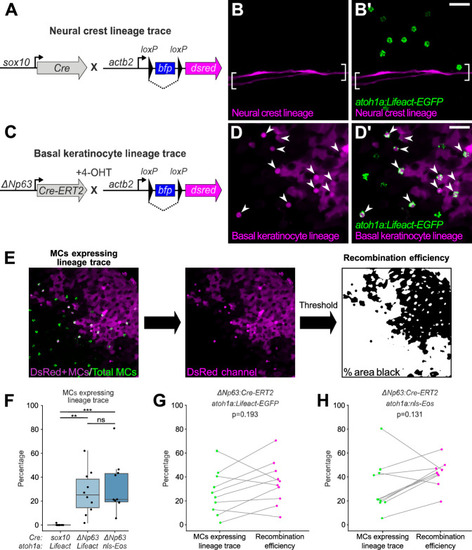
(A) Schematic of Cre-based neural crest lineage tracing strategy. (B) Confocal micrograph of the scale epidermis in an adult expressing neural crest lineage (Tg(sox10:Cre); Tg(actb2:LOXP-BFP-LOXP-DsRed)) and MC (Tg(atoh1a:Lifeact-EGFP)) reporters. Brackets denote Schwann cells associated with a nerve along a scale radius. (C) Schematic of Cre-based basal keratinocyte lineage tracing strategy. (D) Confocal micrograph of the scale epidermis in an adult expressing basal keratinocyte lineage (TgBAC(ΔNp63:Cre-ERT2); Tg(actb2:LOXP-BFP-LOXP-DsRed)) and MC (Tg(atoh1a:Lifeact-EGFP)) reporters, which was treated with 4-hydroxytamoxifen (4-OHT) at 1 day post-fertilization (dpf). Arrowheads indicate MCs labeled by the basal keratinocyte lineage reporter. Note that recombination is not complete, possibly explaining why not all MCs express the lineage reporter. (E) Workflow to calculate percentage of MCs expressing lineage reporter and percentage of total cells expressing lineage reporter. (F) Boxplots of the percentage of MCs expressing the lineage tracing reporters diagrammed in panels A and C. Each dot represents an individual scale. Overall percentage of MCs expressing lineage trace reporters: sox10/Lifeact, 0.3% (1/323 cells; N=6 adults, 27.5–31 mm standard length [SL]); ΔNp63/Lifeact, 29.7% (299/1005 cells; N=6 adults, 21–26 mm SL); ΔNp63/nls-Eos, 32.3% (386/1195 cells; N=4 adults, 20–30 mm SL). A one-way ANOVA (F=12.06; p<0.001) with Tukey’s post-hoc honestly significant difference (HSD) test was used to compare groups. **, p<0.01; ***, p<0.001. (G and H) Paired dot plots of the percentage of MCs expressing the indicated atoh1a reporter and the basal keratinocyte lineage reporter compared to the percentage of all cells in the field of view expressing DsRed. Statistical analyses were performed using the Wilcoxon test. Scale bars: 20 µm.
|
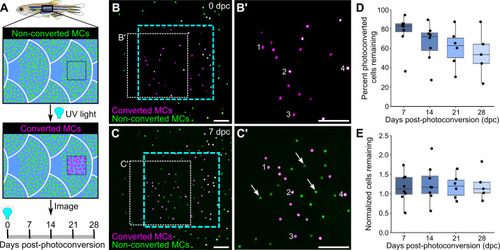
(A) Illustration of the photoconversion experiment showing the epidermis (blue), non-converted MCs (green), and converted MCs (magenta) after exposure of a region of the scale epidermis to UV light. (B and C) Representative images of MCs labeled by Tg(atoh1a:nls-Eos) at 0 (B) or 7 (C) days post-conversion (dpc) from a single adult. Cyan dotted box indicates the photoconverted region. White dotted box indicates the area magnified in B’ and C’. (B’ and C) Numbers label examples of individual cells present at 0 and 7 dpc. Arrows indicate examples of newly added cells, which appear green due to the presence of non-converted nls-Eos (green) and absence of converted nls-Eos (magenta). (D and E) Boxplots of the percentage of photoconverted MCs remaining compared to 0 dpc (D) and the total number of MCs (converted+non-converted) present at each day compared to 0 dpc (E). Each dot represents an individual fish. N=5–8 fish (24–32 mm standard length [SL]). Scale bars: 50 μm.
|
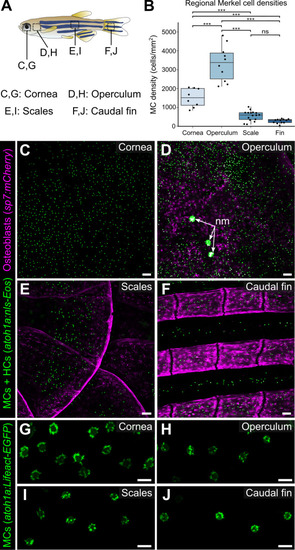
(A) Illustration indicating the epidermal regions imaged in adult zebrafish. (B) Quantification of MC densities in the specified regions. Each dot represents an individual fish (N=8–18, 20–29.5 mm standard length [SL]). *** indicates p<0.001 using a one-way ANOVA (F=83.94; p<0.001) with post-hoc Tukey’s HSD test. (C–J) Lateral confocal micrographs of MCs in the different skin regions from animals expressing the indicated reporters. The regions imaged are indicated in A. Note that MCs expressing Tg(atoh1a:Lifeact-EGFP) have a similar morphology across skin compartments (G–J). nm, neuromasts of the posterior lateral line. Scale bars: 50 μm (C–F) and 10 μm (G–J).
|
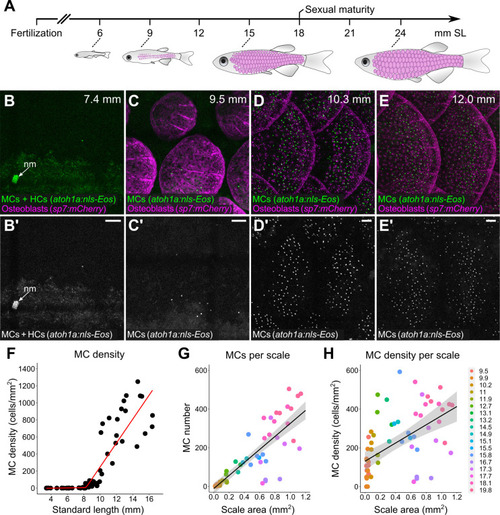
(A) Abbreviated zebrafish developmental timeline relative to standard length (SL) in millimeters. Developing scales are drawn in magenta below the approximate corresponding stage. (B–E) Representative lateral confocal micrographs of MCs and osteoblasts along the trunk at the indicated stages. Note that MCs increase in number and density as scale-forming osteoblasts develop below the epidermis. nm, neuromast of the posterior lateral line. (F) Quantification of MC density according to SL. Each dot represents an individual fish. Data represent n=81 scales from N=52 fish. Line indicates segmented linear regression (breakpoint = 8.27 mm SL). (G and H) Quantification of the number (G) or density (H) of MCs relative to scale area. Each dot represents an individual scale. Data represent n=62 scales from N=18 fish. Dot colors represent animal SL as indicated in the legend. Shading indicates a 95% CI around the linear regression lines in G and H. Correlation coefficients (R2): 0.08 (F, slope 1), 0.68 (F, slope 2), 0.73 (G), and 0.31 (H). F-statistics: 3.5 (F, slope 1), 83.9 (F, slope 2),164.6 (G), and 28.31 (H). p-values: 0.07 (F, slope 1), <0.05 (F, slope 2), and <0.05 (G and H). Scale bars: 50 μm.
|
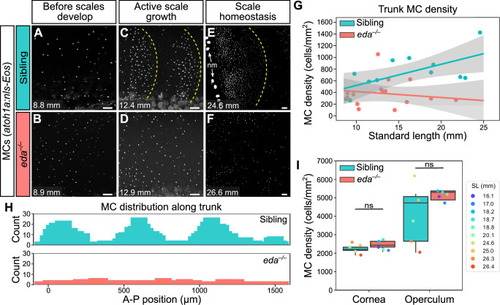
(A–F) Representative confocal images of MCs in the trunk of animals of the indicated genotypes at the indicated stages. Dotted yellow lines indicate posterior scale boundaries. nm, neuromasts of the posterior lateral line. (G) Quantification of MC density in the trunk skin relative to standard length (SL). Gray shading indicates a 95% CI around the linear regression lines. The difference between genotypes was significant above 12.5 mm SL (p<0.05, Johnson-Neyman Technique). Each dot represents an individual fish (N=16–18 fish/genotype). (H) Histograms of the distribution of trunk MCs along a rectangular segment encompassing three scales in a sibling and an identically sized region in an eda mutant (18–19 mm SL). (I) Boxplots of MC densities in the epidermis above the cornea or operculum in animals of the indicated genotypes. ns, not significant (cornea, p=0.21; operculum, p=0.14; Mann-Whitney test). Scale bars: 50 μm (A–F).
|
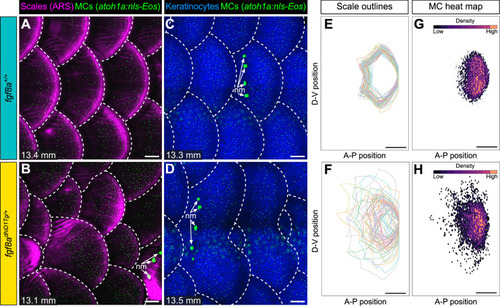
(A–D) Representative images of juvenile animals of the indicated genotypes expressing an MC reporter and stained with Alizarin Red S (ARS) to visualize scales (A and B) or co-expressing MC and keratinocyte (Tg(krt4:DsRed)) reporters (C and D). Dotted lines indicate scale boundaries. nm, neuromasts of the posterior lateral line. (E–H) Tracings of scale outlines (E and F) and density plots of MC position (G and H) from juvenile animals (n=43–49 scales/genotype from N=10–13 fish/genotype; 11.6–14.7 mm standard length [SL]) of the indicated genotypes. Scale tracings were aligned at the dorsal-ventral midpoint of the posterior scale margin. Note the variability in scale shape and size and corresponding increased spread of MC position in fgf8adhiD1Tg/+ juveniles compared to sibling controls. Scale bars: 100 μm (A–D) and 200 μm (E–H).
|