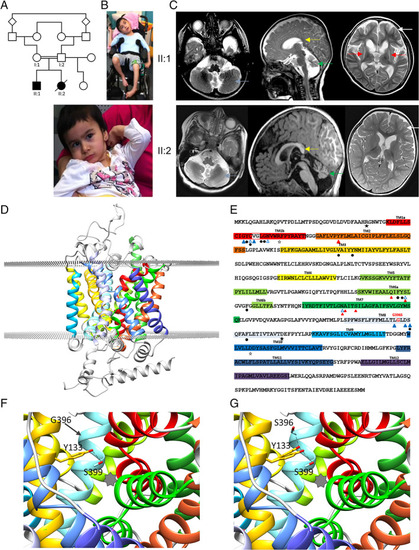
Clinical findings in sibship and the effect of the human L‐proline transporter (hPROT)‐G396S mutation on proline transporter structure and function. (A) Family pedigree, with affected individuals indicated by black shading. (B) Images of patient II:1 at 7 years old supported in a wheelchair with dystonic posturing of all limbs and patient II:2 at 4 years old sitting with support with dystonic upper limb posturing. Both have distinctive facial features with prominent eyebrows, slightly pointed noses, almond‐shaped eyes, and unusual‐shaped, low‐set ears. (C) Brain magnetic resonance imaging studies. Top row: patient II:1, axial (left) and sagittal T2‐weighted sequences (middle) at the age of 7 months, showing cerebellar hypoplasia (blue arrow) and small vermis (green arrows). The corpus callosum is vertically orientated posteriorly (yellow arrow). Repeat T2‐weighted axial sequences at the age of 10 years (right) show bilateral severe putaminal volume loss and T2 hyperintensity suggestive of gliosis (red arrows). Caudate volume loss is also seen without signal change. Enlarged frontal horns and subarachnoid spaces suggestive of bilateral frontal lobe atrophy are also seen (white arrow). Bottom row: patient II:2, age 2 years 4 months: T2 axial (left) and sagittal T1‐weighted sequences (middle) showing cerebellar hypoplasia (blue arrows) and small vermis (green arrow). The corpus callosum is vertically orientated posteriorly (yellow arrow). Relative frontal volume loss with white matter volume reduction is also appreciable on the axial T2 (right, white arrow). (D–G) Modeling of the hPROT transporter. (D) PROT consists of 12 transmembrane helices (highlighted in colors; transmembrane domain [TM] 1–TM12). (E) PROT amino acid sequence. p.Gly396Ser is located in TM8, adjacent to conserved residues located in the binding pocket. Blue triangles (outlined and filled) represent predicted residues involved in coordinating sodium ion Na1 and Na2 binding, respectively; red triangles represent residues predicted to be involved in chloride ion binding; black dots represent predicted residues important for proline binding; and black stars (outlined and filled) represent charged pairs at the extracellular and cytoplasmic entrances, respectively. (F) Structure modeling predicts that Gly396 (G396, TM8, cyan) is in close proximity to Tyr133 (Y133, TM3, orange), a highly conserved residue that is involved in substrate recognition. The star indicates the substrate binding pocket. (G) The introduction of serine with a hydroxyl group at position 396 (TM8, cyan) may alter substrate recognition activity of Y133 by introducing a different group to this region that could engage in H‐bonding with Y133, thereby interfering with its H‐bonding with S399 (two probable alternative rotamers for Y133 are shown). [Color figure can be viewed at wileyonlinelibrary.com]
|
