
- Title
-
MED27, SLC6A7, and MPPE1 Variants in a Complex Neurodevelopmental Disorder with Severe Dystonia
- Authors
- Reid, K.M., Spaull, R., Salian, S., Barwick, K., Meyer, E., Zhen, J., Hirata, H., Sheipouri, D., Benkerroum, H., Gorman, K.M., Papandreou, A., Simpson, M.A., Hirano, Y., Farabella, I., Topf, M., Grozeva, D., Carss, K., Smith, M., Pall, H., Lunt, P., De Gressi, S., Kamsteeg, E.J., Haack, T.B., Carr, L., Guerreiro, R., Bras, J., Maher, E.R., Scott, R.H., Vandenberg, R.J., Raymond, F.L., Chong, W.K., Sudhakar, S., Mankad, K., Reith, M.E., Campeau, P.M., Harvey, R.J., Kurian, M.A.
- Source
- Full text @ Mov. Disord.
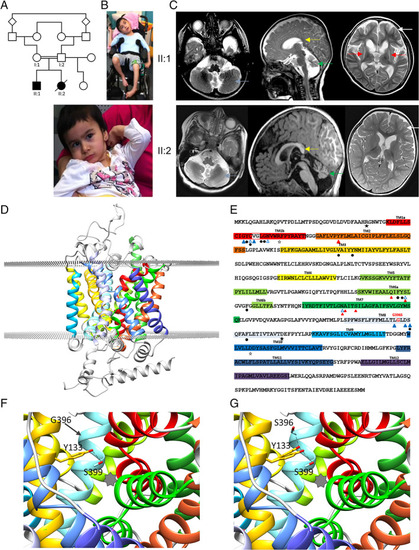
Clinical findings in sibship and the effect of the human L‐proline transporter (hPROT)‐G396S mutation on proline transporter structure and function. ( |
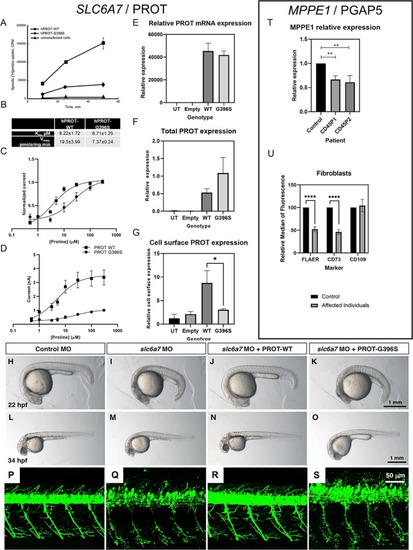
Functional investigations into SLC6A7 and MPPE1 gene variants. (A, B) Time‐course experiments of [3H]L‐proline uptake show decreased L‐proline accumulation in LLC‐PK cells expressing L‐proline transporter (hPROT)‐G396S in comparison with hPROT‐WT (wild type) (A) with decreased maximal uptake velocity (V max) but no differences in K m, n = 4 (B). (C, D) Proline dose responses were measured in Xenopus oocytes expressing WT (n = 5) or G396S (n = 6) hPROT. (C) hPROT‐G396S had reduced apparent affinity for proline (EC50 = 22.05 ± 9.21) compared with WT (EC50 = 4.86 ± 0.49). (D) hPROT‐G396S also had reduced maximal currents (I max = 1.01 nA ± 0.03) compared with WT (I max = 3.37 ± 0.54 nA). All values reported are mean ± standard error of the mean. (E) PROT mRNA expression in HEK293T cells. No significant differences between WT and mutant mRNA expression were evident. (F, G) Biotinylation and immunoblotting analysis showed no significant difference in total protein expression but significantly less expression of hPROT‐G396S at the cell surface compared with hPROT‐WT in transiently transfected HEK‐293T cells (*P < 0.05, Student t test). (H–O) Knockdown of slc6a7 in zebrafish caused a delay in development. Control morpholino oligonucleotide (MO)‐injected larvae were equivalent to 21.9 ± 0.1 hours post fertilisation (hpf) stage (H; n = 40), while slc6a7 morphant development correlated to the 18.6 ± 0.2 hpf stage (I; n = 47). This developmental delay was reversed in zebrafish larvae coinjected with slc6a7 MO and human PROT‐WT RNA to 21.8 ± 0.1 hpf stage at 22 hpf (J; n = 40). The development of zebrafish coinjected with slc6a7 MO and human PROT‐G396S RNA was decelerated to 18.6 ± 0.3 hpf stage at 22 hpf (K; n = 45). Similar observations were made at 34 hpf, where the development of control MO‐injected larvae is equivalent to 33.6 ± 0.3 hpf stage (L; n = 51), while slc6a7 morphant development correlated to 29.0 ± 0.4 hpf stage (M; n = 70). The development of zebrafish larvae coinjected with slc6a7 MO and human PROT‐WT RNA was equivalent to 33.2 ± 0.3 hpf stage at 34 hpf (N; n = 51), while zebrafish coinjected with slc6a7 MO and human PROT‐G396S RNA developed to 29.3 ± 0.4 hpf stage (O; n = 70). (P–S) MO‐mediated knockdown of slc6a7 in transgenic zebrafish expressing YFP in motor neurons resulted in fragile motor neuron morphology (Q) compared with controls (P). This motor neuron phenotype was reversed by coinjection of hPROT‐WT RNA (R), but not by introduction of hPROT‐G396S RNA (S). (T) qPCR of MPPE1 mRNA in patient and healthy control fibroblasts (n = 3 using one healthy age‐ and sex‐matched control and two patient lines; **P < 0.01, Student t test). (U) Cell‐surface expression of GPI‐APs shows that FLAER and CD73 were significantly reduced in patient fibroblasts (n = 6, cells from both patients) compared with control samples (n = 3); ****P < 0.0001 (unpaired parametric t test). No significant differences were seen for CD109. [Color figure can be viewed at wileyonlinelibrary.com] EXPRESSION / LABELING:
PHENOTYPE:
|