
Fig. 2
- ID
- ZDB-FIG-221229-32
- Publication
- Saltari et al., 2021 - Specific activation of the CD271 intracellular domain in combination with chemotherapy or targeted therapy inhibits melanoma progression
- Other Figures
- All Figure Page
- Back to All Figure Page
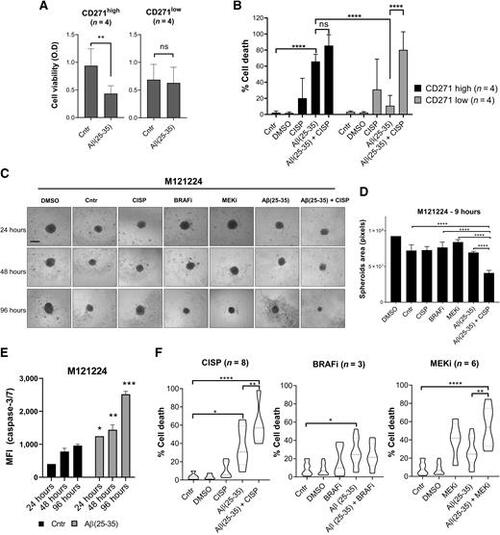
Aβ(25–35) treatment induces cell death in melanoma 2D and 3D cultures. A and B, Eight melanoma cell lines with intrinsic CD271high versus CD271low levels were treated with Aβ(25–35) (40 μmol/L) alone or in combination with cisplatin (30 μmol/L). A and B, MTT assay was performed 24 hours later (A) and cell death (% sub-G1; B) was evaluated by PI staining 72 hours after treatment. C, M121224 3D spheroids were treated with BRAFi (PLX4032; 3 μmol/L), MEKi (MEK162; 200 nmol/L), Aβ(25–35) ± cisplatin and monitored over time. Scale bar, 30 μm. D, Three spheroids/condition were used to measure the area with ImageJ at 96 hours from treatment. E, Caspase-3/7 activity was measured by FACS in M121224 spheres at different time points. F, 3D spheroids were treated with Aβ(25–35) ± cisplatin/BRAFi/MEKi. A total of 144 hours later, spheroids were stained with PI for cell death analysis by FACS. The percentage of cell death (% sub-G1) was measured with FlowJo. Data represent the mean ± SD of triplicate determinations. *, P < 0.05; **, P < 0.01; ***, P < 0.001; ****, P < 0.00001; ns, nonsignificant. |