
- Title
-
Specific activation of the CD271 intracellular domain in combination with chemotherapy or targeted therapy inhibits melanoma progression
- Authors
- Saltari, A., Dzung, A., Quadri, M., Tiso, N., Facchinello, N., Hernandez-Barranco, A., Garcia-Silva, S., Nogués, L., Stoffel, C.I., Cheng, P.F., Turko, P., Eichhoff, O.M., Truzzi, F., Marconi, A., Pincelli, C., Peinado, H., Dummer, R., Levesque, M.P.
- Source
- Full text @ Cancer Res.

CD271 is upregulated by chemo- and MAPKi therapy. A, Melanoma cell lines were treated with carmustine (BCNU), cisplatin (CISP), and dacarbazine (DTIC) and CD271 expression was evaluated 48 hours later by FACS. B, Melanoma patient–derived cells were treated with cisplatin, PLX4032 (BRAFi), and/or MEK162 (MEKi). CD271 levels were analyzed by FACS 72 and 168 hours later. C, Paraffin blocks derived from 13 patients were collected before and after treatment with BRAFi + MEKi and stained with S100 and CD271 Abs. Scale bar, 100 μm. D, Quantification of melanoma CD271+ cells was performed by QuPath. The average of 10 areas was calculated and normalized to S100. Wilcoxon matched-pairs signed rank test was used (**, P < 0.01). E, Melanoma cells were cultured in 3D for 72 hours. Spheroids were treated with trypsin to obtain a single cell suspension and CD271 expression was evaluated by FACS. F, BRAF (WM793B) and NRAS (M130425) mutated targeted therapy sensitive (S) cell lines were cultured with increasing concentration of BRAFi or MEKi to make the cells resistant (R) in vitro. CD271 expression was evaluated by Western blot and FACS comparing resistant versus sensitive cells. |
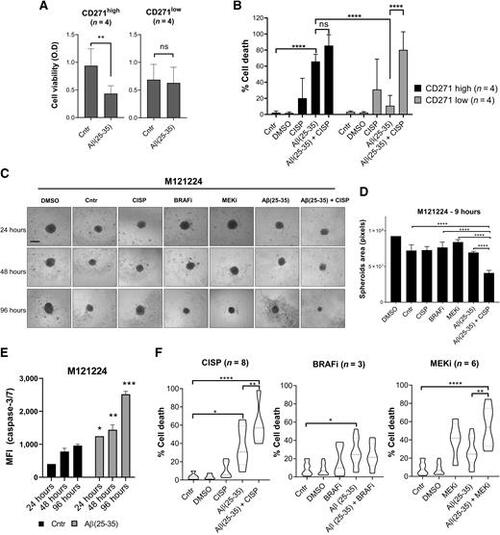
Aβ(25–35) treatment induces cell death in melanoma 2D and 3D cultures. A and B, Eight melanoma cell lines with intrinsic CD271high versus CD271low levels were treated with Aβ(25–35) (40 μmol/L) alone or in combination with cisplatin (30 μmol/L). A and B, MTT assay was performed 24 hours later (A) and cell death (% sub-G1; B) was evaluated by PI staining 72 hours after treatment. C, M121224 3D spheroids were treated with BRAFi (PLX4032; 3 μmol/L), MEKi (MEK162; 200 nmol/L), Aβ(25–35) ± cisplatin and monitored over time. Scale bar, 30 μm. D, Three spheroids/condition were used to measure the area with ImageJ at 96 hours from treatment. E, Caspase-3/7 activity was measured by FACS in M121224 spheres at different time points. F, 3D spheroids were treated with Aβ(25–35) ± cisplatin/BRAFi/MEKi. A total of 144 hours later, spheroids were stained with PI for cell death analysis by FACS. The percentage of cell death (% sub-G1) was measured with FlowJo. Data represent the mean ± SD of triplicate determinations. *, P < 0.05; **, P < 0.01; ***, P < 0.001; ****, P < 0.00001; ns, nonsignificant. |
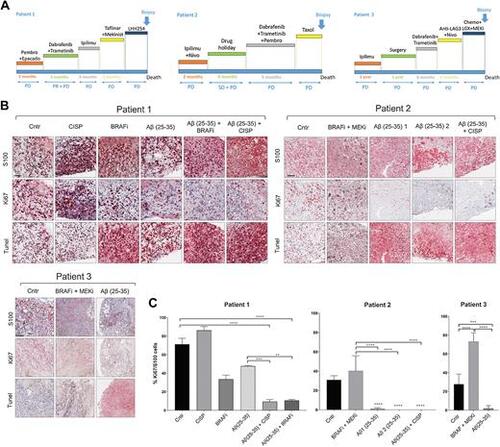
Aβ(25–35) reduces viability and induces cell death in ex vivo patient cultures. A, Patient's treatment history. B, Tumor slices were cultured in the presence of different treatments for 5 days and stained with IHC. PD, progressive disease; PR, partial response; SD, stable disease. Scale bar, 100 μm. C, QuPath was used to quantify the number of Ki67 positive cells. The average of 10 different areas was normalized to S100. One-way ANOVA was used for statistical analysis. **P, < 0.01; ***, P < 0.001; ****, P < 0.00001. |

Aβ(25–35) prevents melanoma invasion and metastasis formation in vivo. A and B, M980513 (S, sensitive) and M121224 (R, resistant) spheres were implanted into a matrix of collagen I and treated with Aβ(25–35) 40 μmol/L ± cisplatin/BRAFi/MEKi. A total of 168 hours later, spheres were stained to evaluate the live (calcein; green)/dead (ethidium; red) cells. Scale bar, 30 μm. B, The live/dead ratio was analyzed in six spheres/condition by Photoshop. C, MAPKi-sensitive and resistant melanoma cells were stained with Vibrant Dye (red) and injected into the yolk of zebrafish larvae. Twenty-four hours later, zebrafish were treated with BRAFi/MEKi and Aβ(25–35) was injected into the yolk the day after. Pictures were taken 4 days later and the number of zebrafish with metastasis (D) was evaluated by two blind investigators. Data represent the mean ± SD of two independent experiments (tot = 660). One-way ANOVA was used for statistical analysis. **, P < 0.01; ***, P < 0.001. E, M000921-injected zebrafish were stained with S100, Ki67, Slug/Snail, and TUNEL. Scale bar, 500 μm (5×) and 100 μm (20×). F, A total of 500000 M121224 cells were subcutaneously injected in 9-weeks-old female nude mice. When tumor reached approximately 50 mm3, BSA or 15 μg Aβ(25–35) was intratumorally injected three times a week. Tumor growth was measured using an electronic caliper. Mice were sacrificed when control tumors reached 1,000 m3. Fold increase was calculated using each individual measure at day 7 to standardize. Representative images are shown (n = 5–8 tumors/group. G, Caspase-3 staining was performed on six tumors/group and quantified by QuPath. Scale bar, 4 mm (5×) and 200 μm (40×). Two-way Anova; **, P ≤ 0.01. |
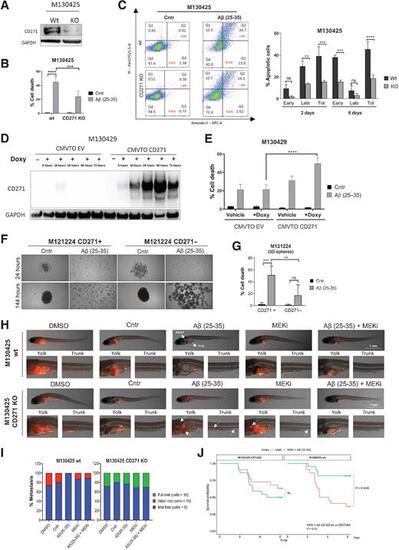
CD271high cells display a greater susceptibility to Aβ(25–35)-induced death. A, CD271 silencing was confirmed by Western blot. B, Melanoma cells were treated with Aβ(25–35) 40 μmol/L and the amount of dead cells (% sub-G1) was measured by PI staining at the FACS. C, AnnexinV/PI assay was performed to evaluate the percentage of early and late apoptotic cells. D, CMVTO_EV- and CMVTO_CD271-transfected cells were treated with doxycycline, and proteins were collected to evaluate CD271 induction by Western blot. E, Melanoma cells were treated with doxycycline for 48 hours, followed by Aβ(25–35) administration. PI staining was performed 24 hours later and the percentage of dead cells was measured by FACS. F, M121224 CD271+ and − cells were seeded as spheroids and treated with Aβ(25–35). Twenty-four and 144 hours later, brightfield pictures were taken and PI staining (G) was performed. Data represent the mean ± SD of triplicate determinations. H, M130425 wt and CD271 KO cells were injected into the yolk of zebrafish larvae and treated with Aβ(25–35) ± MEKi. Pictures of wt are the same of Fig. 4C. I, The severity of metastasis was evaluated 4 days later by two blind investigators. J, Probability of survival in zebrafish injected with wt versus CD271 KO cells. Two-way ANOVA was used for statistical analysis. **, P < 0.01; ***, P < 0.001; ****, P < 0.00001; ns, nonsignificant. |
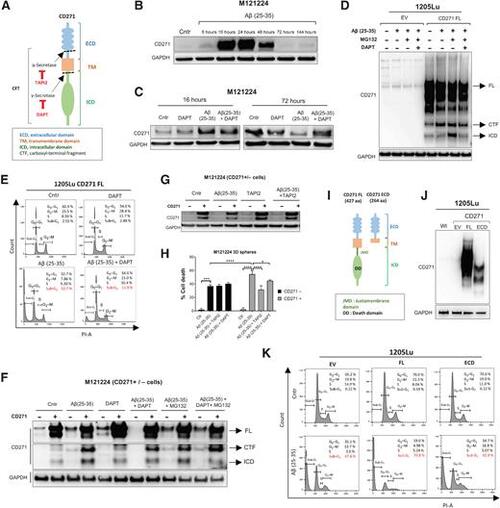
CD271 cleavage is required to activate Aβ(25–35)-induced apoptosis. A, Representation of CD271 cleavage sites and the inhibitors used. B, CD271 levels were evaluated by Western blot after treatment with Aβ(25–35) at different time points. C, M121224 cells were seeded in six-well plates and treated with Aβ(25–35) 40μmol/L ± DAPT (200 nmol/L) for 16 and 72 hours. Protein extracts were immunoblotted with CD271. D, 1205Lu CD271 EV and FL (full length) cells were pretreated with Aβ(25–35) 40 μmol/L for 23 hours, then MG132 (20 μmol/L) + DAPT (300 nmol/L) were added for 1 hour. CTF and ICD formation was evaluated by Western blot. E–G, 1205Lu FL cells were treated for 1 hour with DAPT (300 nmol/L; E), then Aβ(25–35) 40 μmol/L was added in the medium for 30 minutes and PI staining was performed CD271 + and − sorted cells were treated with Aβ(25–35) ± DAPT (300 nmol/L)/MG132 (20 μmol/L)/TAPI2 (500 nmol/L; F and G). CD271 was evaluated by Western blot. H, Cell cycle by FACS. Two-way ANOVA was used for statistical analysis. *, P < 0.05; ***, P < 0.001; ****, P < 0.00001. I, CD271 FL and ECD structure. J, 1205Lu wt, EV, FL, and ECD lysates were immunoblotted for CD271 Ab. K, Melanoma cells were treated for 1 hour with Aβ(25–35) (40 μmol/L) and stained with PI for cell-cycle evaluation by FACS. |

Melanoma cell death is triggered by Aβ(25–35)-mediated activation of CD271–JNK pathway and mitochondrial ROS production. A, Western blot on melanoma cells were treated with Aβ(25–35) (40 μmol/L) at different time points. CD271 and GAPDH belong to the same Western blot shown in Fig. 6B. B and C, M121224 wt cells were treated with Aβ(25–35) (40 μmol/L) ± DAPT (200 nmol/L) or JNKi (SP600125; 300 nmol/L) and Western blot was performed. D, M121224 wt and CD271 KO cells were treated for 48 hours with Aβ(25–35) (40 μmol/L). Lysates were pulled-down with CD271 Ab, and supernatant (Sup) and immunoprecipitates (IP) were immunoblotted with different Abs. E, Melanoma cells were treated with Aβ(25–35) (40 μmol/L) ± JNKi (SP600125; 200 nmol/L) for 1 hour and stained with PI. The percentage of cell death was evaluated by FACS. Two-way ANOVA was used for statistical analysis. **, P < 0.01; ***, P < 0.001.F, Tumor slices were treated for 5 days and stained with Ki67 and S100 Abs. Ki67+ cells were quantified by QuPath. The average of 10 areas was normalized to the total S100. Two-way ANOVA was used for statistical analysis. ****, P < 0.00001. Scale bar, 100 μm. “Cntr” are the same pictures shown also in Fig. 3 (patient 2 and 3). G, Cells were stained with MitoSOX (5 μmol/L) and the levels of mROS were measured by FACS. Data represent the mean ± SD of triplicate determinations. One-way ANOVA was used for statistical analysis. **, P < 0.01; ***, P < 0.001. H, Melanoma cells were treated with Aβ(25–35) (40 μmol/L) ± NAC (5 mmol/L) for 72 hours and stained with MitoSOX. mROS were measured by FACS. I, M121224 were treated with Aβ(25–35) alone or in combination with JNKi (200 nmol/L) ± NAC (5 mmol/L). Cells were stained with PI and the percentage of cell death was evaluated by FACS. One-way ANOVA was used for statistical analysis. *, P < 0.05; ***, P < 0.001; ****, P < 0.00001. J, M121224 cells were treated with Aβ(25–35) and mROS were measured by FACS at different time points. K, M121224 CD271+ cells were treated with Aβ(25–35) (40 μmol/L) ± NAC (5 mmol/L) for 48 hours. CD271 levels were evaluated by Western blot. L, Graphical representation of CD271–JNK–ROS pathway induced following Aβ(25–35) treatment. ns, nonsignificant. |