FIGURE

Figure 3

ID
ZDB-FIG-221226-163
Publication
López-Cuevas et al., 2022 - Macrophage Reprogramming with Anti-miR223-Loaded Artificial Protocells Enhances In Vivo Cancer Therapeutic Potential
Other Figures
All Figure Page
Back to All Figure Page
Figure 3

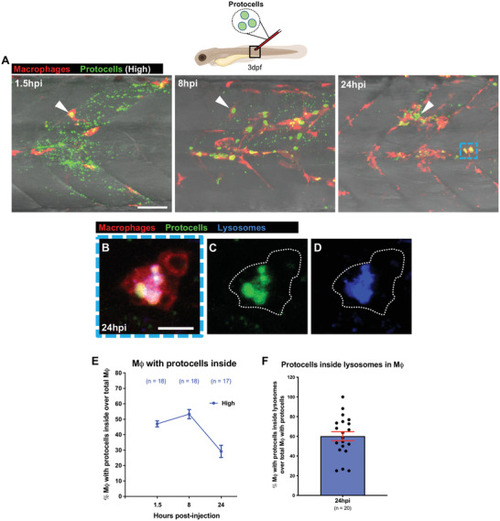
Locally injected protocells are taken up by macrophages. A) Multi‐channel confocal images of the flank of Tg(mpeg1:mCherry) larvae after local injection of FITC‐protocells at 3 dpf and imaged at 1.5, 8, and 24 hpi showing the distribution of protocells within macrophages (white arrowheads) and dispersed along the fish somite (injection site). See also Movie S9, Supporting Information. B–D) Multi‐channel (B) or single‐channel (C,D) confocal images showing the lysosomal fate of internalized FITC‐protocells within a macrophage (white dotted outlines) after local injection of protocells at 24 hpi (blue dashed box in [A]). E,F) Graphs showing percentage of macrophages containing protocell(s) (E) or with overlaying protocells and lysosomes (F) quantified from the regions imaged in (A). “High” corresponds to the protocell concentration injected (1.25 × 107 protocells/µL). Accompanying schematic illustrates developmental stage (larva), type of injection (local), and imaged area (black outlined box) used for the experiment. Data are pooled from three independent experiments. Graphs show mean ± SEM. In graph (E) each dot represents the mean of all fish analyzed, and in graph (F) each dot represents one fish. Mϕ = macrophages; n = number of fish. Scale bars = 50 µm (A), 10 µm (B).

Expression Data

Expression Detail
Antibody Labeling
Phenotype Data

Phenotype Detail
Acknowledgments
This image is the copyrighted work of the attributed author or publisher, and ZFIN has permission only to display this image to its users. Additional permissions should be obtained from the applicable author or publisher of the image. Full text @ Adv Sci (Weinh)