FIGURE

Figure 1

ID
ZDB-FIG-221226-158
Publication
López-Cuevas et al., 2022 - Macrophage Reprogramming with Anti-miR223-Loaded Artificial Protocells Enhances In Vivo Cancer Therapeutic Potential
Other Figures
All Figure Page
Back to All Figure Page
Figure 1

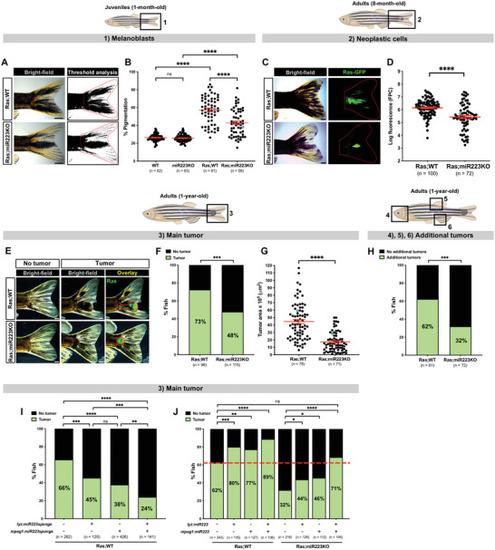
miR223 inhibition reduces cancer progression in zebrafish. A) Pigmentation of the tailfin quantified by threshold analysis of tail region (red dotted outline) in 1‐month‐old cancerous Ras;WT versus Ras;miR223KO juvenile fish. B) Dot plot showing percentage of pigmentation quantified from the regions imaged in (A) and (1). C) Ras‐GFP expression in the tail area (red dotted outline) of 8‐month‐old cancerous Ras;WT versus equivalent Ras;miR223KO adult fish. D) Dot plot showing levels of Ras‐GFP expression as quantified by fluorescent pixel count (FPC) from the regions imaged in (C) and (2). E) 1‐year‐old cancerous Ras;WT versus Ras;miR223KO adult fish bearing (or not) a tumor mass (red outline) on their tail. F) Bar chart showing percentage of cancerous fish with or without a tail tumor quantified from the regions imaged in (E) and (3). G) Dot plot showing tumor area quantified from the regions imaged in (E) and (3). H) Bar chart showing percentage of cancerous Ras;WT versus Ras;miR223KO adult fish bearing tailfin tumors, and any additional tumor (or not), quantified from the regions imaged in (4)–(6). See also Figure S1, Supporting Information. I) Bar chart showing percentage of 1‐year‐old cancerous adult fish with or without tumor, quantified from the regions imaged in (E) and (3), that are expressing miR223sponge in neutrophils (lyz:miR223sponge‐positive), macrophages (mpeg1:miR223sponge‐positive), or both lineages, in an otherwise Ras;WT background. See also Figure S2A–D, Supporting Information. J) Bar chart showing percentage of 1‐year‐old cancerous adult fish with or without tumor, quantified from the regions imaged in (E) and (3), that are overexpressing miR223 in neutrophils (lyz:miR223‐positive), macrophages (mpeg1:miR223‐positive), or both lineages, in Ras;WT or Ras;miR223KO backgrounds; red dashed line marks the percentage of control Ras;WT fish (lyz:miR223mpeg1:miR223‐double‐negative) with tumor. See also Figure S2E–H, Supporting Information. Accompanying schematics illustrate developmental stage (juvenile or adult) and imaged area (black outlined box) used for each experiment. Data are pooled from three independent experiments, and analyzed using one‐way ANOVA test with Bonferroni's multiple comparisons test (B), unpaired two‐sided Mann–Whitney test (D,G), or Fisher's exact test (F,H–J), ns p ≥ 0.05, *p < 0.05, **p < 0.01, ***p < 0.001, ****p < 0.0001. Graphs (B), (D), and (G) show mean ± SEM; each dot represents one fish and blue dots correspond to the representative images shown in the panels. n = number of fish. Scale bars = 1 mm.

Expression Data

Expression Detail
Antibody Labeling
Phenotype Data

Phenotype Detail
Acknowledgments
This image is the copyrighted work of the attributed author or publisher, and ZFIN has permission only to display this image to its users. Additional permissions should be obtained from the applicable author or publisher of the image. Full text @ Adv Sci (Weinh)