
Fig. 3
- ID
- ZDB-FIG-221215-14
- Publication
- Cheng et al., 2021 - Small-molecule probe reveals a kinase cascade that links stress signaling to TCF/LEF and Wnt responsiveness
- Other Figures
- All Figure Page
- Back to All Figure Page
Chemical activation of HIPK2
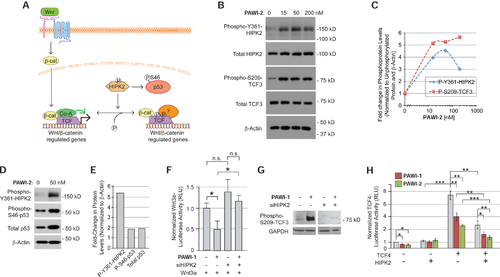
A) Model of the role of HIPK2 in regulating the stabilization of p53 and the localization of TCF proteins on chromatin. B,C) Effect of PAWI-2 (0–200 nM, for 4 hours) on Y361 phosphorylation of endogenous HIPK2 in non-transfected HEK293T cells and S209 phosphorylation of TCF3 in HEK293T cells transfected to express flag-tagged TCF3 (B) by Western blotting. Densitometry quantification is shown in (C). D,E) Effect of PAWI-2 (50 nM) on S46 phosphorylation and total protein levels of p53, assayed as in (B). F) Effect of siRNA knockdown of HIPK2 on the ability of PAWI-1 (200 nM) to inhibit Wnt3a/β-catenin signaling, as measured in HEK293T cells transfected with a TCF-luciferase reporter gene and treated with recombinant Wnt3a (10% conditioned media of HEK293T cells overexpressing Wnt3a). Error bars, s.e.m. (n=6). G) Effect of siRNA knockdown of HIPK2 on the S209 phosphorylation of TCF3 in response to PAWI-1 (200 nM). H) Effect of HIPK2 overexpression on PAWI-1 and PAWI-2 (50 nM) inhibition of TCF4 activity, as measured using a TCF-luciferase reporter in HEK293T cells. HIPK2, PAWI-1 and PAWI-2 inhibit TCF4-dependent signaling. Error bars, s.e.m. (n=3). *, ** and *** indicate p-values <0.05, <0.01, and <0.001 respectively (T-test). |