
- Title
-
Small-molecule probe reveals a kinase cascade that links stress signaling to TCF/LEF and Wnt responsiveness
- Authors
- Cheng, J., Tsuda, M., Okolotowicz, K., Dwyer, M., Bushway, P.J., Colas, A.R., Lancman, J.J., Schade, D., Perea-Gil, I., Bruyneel, A.A.N., Lee, J., Vadgama, N., Quach, J., McKeithan, W.L., Biechele, T.L., Wu, J.C., Moon, R.T., Si Dong, P.D., Karakikes, I., Cashman, J.R., Mercola, M.
- Source
- Full text @ Cell Chem Biol

Chemical structures and effect of Compounds 1 and 2 on Wnt
A) Scheme for high throughput screen. The primary assay quantified inhibition of Wnt3a in an RKO cell line engineered with a TCF-responsive firefly luciferase reporter and internal control Renilla luciferase. 76,000 small molecules were screened (see Methods). To rule out non-specific inhibitors, a NF-κB responsive luciferase reporter assay was used as a counter screen (see Methods). Inhibitors likely to act at or downstream of β-catenin stabilization were selected based upon inhibition of the GSK3 inhibitor BIO in the RKO TCF-luciferase primary screen assay. B) Structures of PAWI-1, PAWI-2 and an IWR-1 analogue (Lanier et al., 2012; Willems et al., 2011). IC50 values for inhibition of Wnt3a (100 ng/ml)-stimulated Super TOPflash TCF-luciferase reporter activity were determined in HEK293T cells; n=6; error bars, s.e.m. C) PAWI-1 (500 nM) effect on induction of Wnt/β-catenin target genes c-MYC, CCND and AXIN2, as compared to DMSO vehicle alone control, in SW480 cells that have endogenous Wnt signaling. n=4; error bars, s.e.m. * indicates p-value <0.05 (T-test). D) Effect of PAWI-1 (500 nM) on NF-κB, Notch and TGFβ signaling pathways (black bars), as determined using specific luciferase reporters in HEK293T cells (see Methods) and compared to DMSO vehicle controls (light bars). n=4; error bars, s.e.m. * indicates p-value <0.05 (T-test). E) Effect of PAWI-1 (500 nM) on adult zebrafish tail fin regeneration. Compound was present for first 7 days post amputation (dpa) and removed for remaining time to 30 dpa (washout). PAWI-1 inhibited regeneration at 7dpa, but regeneration resumed after washout (16 and 30 dpa) indicating reversibility. Arrowheads (red) indicate the point of resection. |
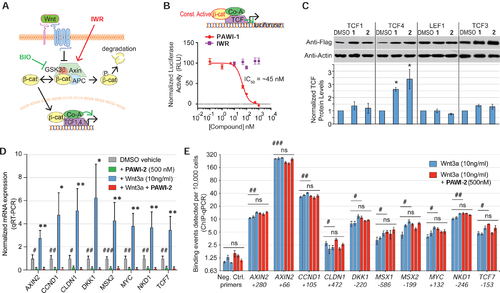
Inhibition of TCF transcriptional activity
A) Schematic depicting the core canonical Wnt signaling cascade. B) Scheme depicts β-catenin luciferase assay. Effect of PAWI-1 and an IWR-1 analogue on a constitutively active mutant form of β-catenin protein expressed in HEK29T cells together with a TCF-luciferase reporter gene. PAWI-1 IC50 = 45.5 nM. Error bars represent s.e.m (n=3). C) Effect of PAWI-1 and PAWI-2 on TCF proteins. HEK293T cells were transfected to express flag-tagged TCF proteins and treated with either DMSO vehicle or compounds (500 nM) for 24 hours. Western blotting shows the levels of the TCF proteins. Error bars represent s.e.m (n=3, TCF1, TCF4, LEF1; n=4, TCF3). D) RT-qPCR showing gene expression of canonical Wnt-inducible genes in HEK293T cells at following treatment with DMSO (vehicle for PAWI-2), PAWI-2 (500 nM), recombinant Wnt3a (10 ng/ml), and Wnt3a plus PAWI-2. Data were normalized to GAPDH expression and DMSO vehicle. Error bars represent s.e.m. (n=5). E) ChIP PCR of promoter regions of Wnt/β-catenin target genes in HEK293T cells treated as in panel D. The centers of the amplified regions are indicated. 3 biological replicates (blue and red bars). Error bars represent s.e.m. (n=3 technical replicates). ns indicates not statistically significant; *,#; **,## and ***,### indicate p-values of <0.05, <0.01 and <0.001, respectively (T-test of biological replicates). In panel D, symbols indicate comparisons of PAWI-2-treated to respective DMSO vehicle (#) or to Wnt3a-induced (*) levels. In panel E, symbols indicate comparisons of specific TCF4 binding sites versus negative control sites (#) or to Wnt3a versus respective Wnt3a + PAWI-2 treated (ns). |
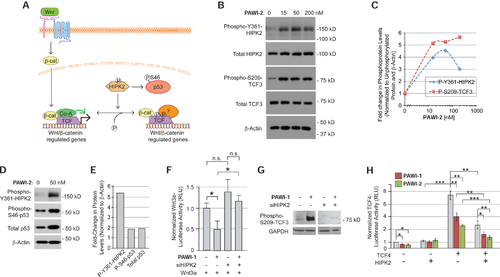
Chemical activation of HIPK2
A) Model of the role of HIPK2 in regulating the stabilization of p53 and the localization of TCF proteins on chromatin. B,C) Effect of PAWI-2 (0–200 nM, for 4 hours) on Y361 phosphorylation of endogenous HIPK2 in non-transfected HEK293T cells and S209 phosphorylation of TCF3 in HEK293T cells transfected to express flag-tagged TCF3 (B) by Western blotting. Densitometry quantification is shown in (C). D,E) Effect of PAWI-2 (50 nM) on S46 phosphorylation and total protein levels of p53, assayed as in (B). F) Effect of siRNA knockdown of HIPK2 on the ability of PAWI-1 (200 nM) to inhibit Wnt3a/β-catenin signaling, as measured in HEK293T cells transfected with a TCF-luciferase reporter gene and treated with recombinant Wnt3a (10% conditioned media of HEK293T cells overexpressing Wnt3a). Error bars, s.e.m. (n=6). G) Effect of siRNA knockdown of HIPK2 on the S209 phosphorylation of TCF3 in response to PAWI-1 (200 nM). H) Effect of HIPK2 overexpression on PAWI-1 and PAWI-2 (50 nM) inhibition of TCF4 activity, as measured using a TCF-luciferase reporter in HEK293T cells. HIPK2, PAWI-1 and PAWI-2 inhibit TCF4-dependent signaling. Error bars, s.e.m. (n=3). *, ** and *** indicate p-values <0.05, <0.01, and <0.001 respectively (T-test). |

Activation of the ATM kinase cascade
A) Design of the siRNA screen to elucidate target space. siRNAs against 98 proteins involved in ATM regulation were screened for ability to prevent inhibition of Wnt3a/β-catenin firefly luciferase activity by PAWI-2 (100 nM), measured in the TCF-responsive pBARLRen reporter cells and normalized to Renilla luciferase as in the primary screen. B) Screen results expressed as a Z-score relative to control (inert sequence) siRNA (blue). C) Plot of % inhibition of Wnt3a-dependent luciferase activity for siRNAs with Z-score ≥ 2 (red). n=4; error bars = s.e.m. D,E) Western blots showing the effect of siRNA knockdown of Aurora kinases and BUB3 on the ability of PAWI-2 (200 nM, 4 hours) to induce S1981 phosphorylation of ATM in SW480 cells (D). Quantification of phospho-S1981-ATM normalized to total ATM protein levels (E). Note siRNA directed against AURKB and BUB3 prevented phosphorylation of ATM in response to PAWI-2. n=4; * indicates p-value <0.05 (T-test). F) Western blot showing effect of PAWI-2 (0–200 nM, 4 hours) on S15 phosphorylation and total p53 in HEK293 cells, and quantification of phospho-S15 and total p53 normalized to β-actin levels. G) PAWI-2 (100 nM, 24 hours) induction of p53 target genes and simultaneous suppression of Wnt/β-catenin target genes in HEK293T cells treated with recombinant Wnt3a (100 ng/ml) by TaqMan qRT-PCR. Error bars = s.e.m. (n=4). *,**, *** indicates p-value <0.05, <0.01, <0.005 (T-test). H) Model that PAWI-1, 2 mimics stress signaling to activate p53 and modulate the ability of a cell to respond to Wnt. PAWI compounds bind tubulin and activate ATM and HIPK2 at lower concentrations than needed to destabilize microtubules. ATM and HIPK2 phosphorylate and activate p53. HIPK2 also phosphorylates TCF/LEF proteins modifying their availability for Wnt/β-catenin transcriptional activity. Points of siRNA block that were used to substantiate the model in panels B,C,D and Fig. 3F,,GG are indicated. |