
Figure 5
- ID
- ZDB-FIG-221214-281
- Publication
- Zhang et al., 2022 - Requirement of Zebrafish Adcy3a and Adcy5 in Melanosome Dispersion and Melanocyte Stripe Formation
- Other Figures
- All Figure Page
- Back to All Figure Page
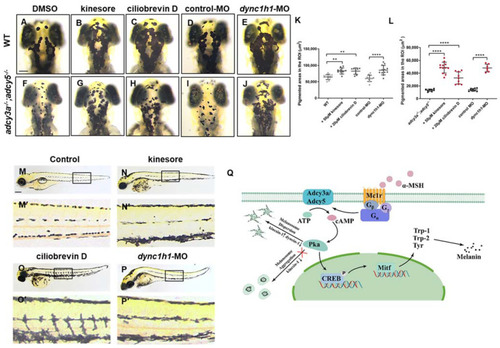
Activation of kinesin-1 or Inhibition of cytoplasmic dynein-1 rescues the phenotype of high melanosome aggregation in adcy3a-/-;adcy5-/- double mutants. (A–C) WT embryos treated with either kinesore or ciliobrevin D from 24 hpf to 96 hpf show high melanosome dispersion when compared with DMSO controls. (D,E) dync1h1-MO-injected WT embryos display significant melanosome dispersion compared with control-MO-injected embryos. (F–H) adcy3a-/-;adcy5-/- double mutants show significant dispersion of melanosomes when treated with either kinesore or ciliobrevin D from 24 hpf to 96 hpf compared with DMSO-treated groups. (I,J) adcy3a-/-;adcy5-/- double mutants injected with dync1h1-MO exhibit significant dispersion of melanosomes in comparison with controls. (K,L) Statistical analysis of pigmentation coverage in WT embryos (K) and adcy3a-/-;adcy5-/- double mutants (L) treated with DMSO, kinesore, and ciliobrevin D, respectively, as well as either injected with dync1h1-MO or control-MO (Student’s t-test, ** p < 0.01. **** p < 0.0001). (M–O) The dispersion of melanosomes throughout the body is detected in kinesore (N,N′) or ciliobrevin D-treated adcy3a-/-;adcy5-/- double mutants (O,O′), compared with DMSO-treated groups (M,M′). (M′–O′) are the partially magnified images of boxes in (M–O). (P) dync1h1-MO injected adcy3a-/-;adcy5-/- double mutants display melanosome dispersion throughout the body. (P′) is the partially magnified images of boxes in (P). (Q) A working model for Adcy3a and Adcy5 signaling cascades involving melanosome dispersion and melanin synthesis: α-MSH binds to Mc1r and activates Adcy3a and Adcy5, leading to intracellular cAMP increase; the increased cAMP stimulates Pka to guide melanosome dispersion by activating kinesin-1 and suppressing cytoplasmic dynein-1, and promotes melanin synthesis through increasing the expression of mitf and its downstream target genes tyr, trp-1, and trp-2. Scale bar = 100 μm in (A–J). Scale bar = 250 μm in (M–P). |
| Fish: | |
|---|---|
| Conditions: | |
| Knockdown Reagent: | |
| Observed In: | |
| Stage Range: | Prim-5 to Day 4 |