
Figure 5
- ID
- ZDB-FIG-221211-191
- Publication
- Gebuijs et al., 2022 - Targeting fibroblast growth factor receptors causes severe craniofacial malformations in zebrafish larvae
- Other Figures
- All Figure Page
- Back to All Figure Page
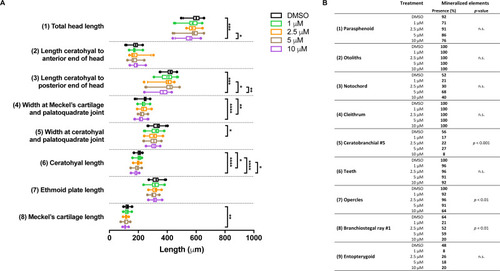
Morphometric analyses of cartilage and bone elements in 5 dpf wild type larvae treated with BGJ398 dissolved in DMSO (final DMSO concentration 0.1%) during 24–36 hpf.
(A) The length of the cartilage elements. The controls were exposed to only the vehicle, DMSO at a final concentration of 0.1% (n = 25). The group sizes of the 1, 2.5, 5 and 10 µM exposure were n = 24, 23, 22 and 25, respectively. Medians are represented by lines within the boxes; the boxes show interquartile ranges. Whiskers are drawn left to the 5th percentile and right to the 95th. Points beyond the 5–95 interval are drawn as individual dots. The mean is indicated by a “+” symbol. Data were statistically analyzed by non-parametric Kruskal–Wallis test. Asterisks indicate significant differences; ∗p < 0.05, ∗∗p < 0.01, ∗∗∗p < 0.001, ∗∗∗∗p < 0.0001. (B) Percentages of mineralized elements present in DMSO controls (n = 25), 1 µM (n = 24), 2.5 µM ( n = 23), 5 µM (n = 22) or 10 µM (n = 25) BGJ398. Data were statistically analyzed by Fisher’s exact test. |