
- Title
-
Targeting fibroblast growth factor receptors causes severe craniofacial malformations in zebrafish larvae
- Authors
- Gebuijs, L., Wagener, F.A., Zethof, J., Carels, C.E., Von den Hoff, J.W., Metz, J.R.
- Source
- Full text @ Peer J.
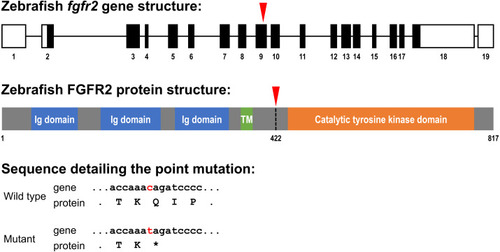
Schematic representation of the zebrafish fgfr2 gene and protein structure.
(A) Five highly similar transcript variants have been found; variant 1 is depicted here (transcript fgfr2-201 in Ensembl; NCBI Reference Sequence: NM_001243004.1). The fgfr2 gene consists of 19 exons, of which 17 coding exons. Note that the exons (depicted as boxes) are drawn on a 20-times larger scale than the introns (depicted as lines). The full gene transcript is 4,741 bp long; the coding sequence is 2,451 bp running from exon 2 to exon 18 (indicated by black filling). The red arrowhead pointing down indicates the site of the mutation in the fgfr2 sa10729 mutant zebrafish used in the current study. (B) The gene encodes an 817 amino acid protein. The protein is characterized by three immunoglobulin (Ig) domains, a transmembrane (TM) region and a tyrosine kinase domain. The truncated FGFR2 protein that results from the mutation consists of 421 amino acids (premature stop codon indicated by the red arrowhead pointing down). (C) Partial nucleotide (lower case) and amino acid (upper case) sequence detailing the point mutation. The c > t mutation causes a stop codon (indicated by the asterisk). |

Morphometrical analysis of cartilage and bone elements wild type, heterozygous and mutant fgfr2 zebrafish at 5 dpf.
Morphometrical analysis of cartilage and bone elements wild type, heterozygous and mutant fgfr2 zebrafish at 5 dpf. (A) Ventral view of wild type zebrafish stained for cartilage (blue) and bone (red) indicating the parameters 1–6 assessed in this study. The scale bar indicates 200 µm. (B) A lateral view to indicate morphometrical parameter 7 (the ethmoid plate) and 8 (Meckel’s cartilage). (C) Ventral view to indicate the nine mineralized elements scored for presence or absence. (D) The length of the cartilage elements in the three genotypes of zebrafish: wildtypes (+/ +, n = 17), heterozygotes (+/ −, n = 28) and homozygous mutants (−/ −, n = 26). The median is represented by the line within the box; the box shows interquartile range. The whiskers are drawn left to the 5th percentile and right to the 95th. Points beyond the 5–95 interval are drawn as individual dots. The mean is indicated by a “+” symbol. Data were statistically analyzed using non-parametric Kruskal–Wallis test and asterisks indicate statistical differences; ∗∗p < 0.01, ∗∗∗ p < 0.001. (E) Percentages of mineralized elements present in wildtypes (+/ +, n = 17), heterozygotes (+/ −, n = 31) and homozygous mutants ( −/ −, n = 26). Data were statistically analyzed by Fisher’s exact test. PHENOTYPE:
|
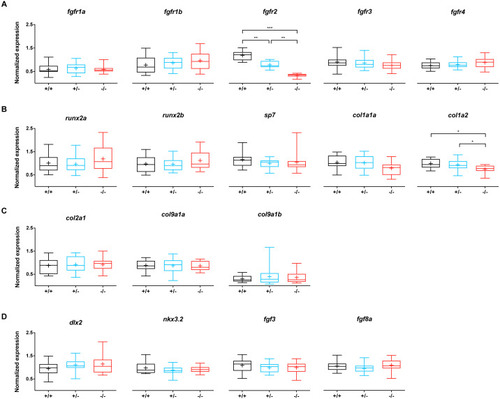
Relative expression levels of 17 genes at 5 dpf in wildtype (n = 14), fgfr2+/− (n = 18) and −/− (n = 12) zebrafish larvae.
(A) Expression of fgfr s reveals that fgfr2 is downregulated in our mutants. (B) Expression of genes involved in bone formation. (C) Genes involved in cartilage formation were not significantly different among groups. (D) Neural crest cell marker genes. In the box plots the median is represented by the line within the box; the box shows interquartile ranges. Whiskers are drawn down to the 5th and up to the 95th percentile. Points below and above the whiskers are drawn as individual dots. The mean is indicated by a “+” symbol. All the data were analyzed using a Kruskal–Wallis test followed by a Dunn’s multiple comparison test. Asterisks indicate significant differences; ∗p < 0.05, ∗∗p < 0.01, ∗∗∗p < 0.001. |
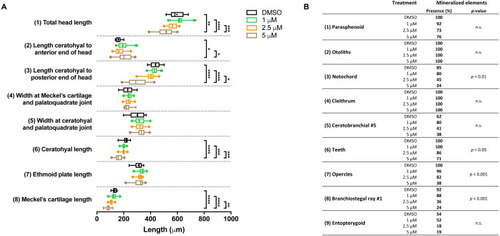
Morphometric analyses of cartilage and bone elements in 5 dpf wild type larvae treated with BGJ398 during 0–12 hpf.
(A) The length of the cartilage elements. The controls were exposed to only the vehicle, DMSO at a final concentration of 0.1% (n = 13). The group sizes of the 1, 2.5 and 5 µM exposure were n = 25, 22 and 21, respectively. Medians are represented by lines within the boxes; the boxes show interquartile ranges. Whiskers are drawn left to the 5th percentile and right to the 95th. Points beyond the 5–95 interval are drawn as individual dots. The mean is indicated by a “+” symbol. Data were statistically analyzed by non-parametric Kruskal–Wallis test. Asterisks indicate significant differences; ∗p < 0.05, ∗∗p < 0.01, ∗∗∗p < 0.001, ∗∗∗∗p < 0.0001. (B) Percentages of mineralized elements present in DMSO controls (n = 13), 1 µM (n = 25), 2.5 µM ( n = 22) or 5 µM (n = 21) BGJ398. Data were statistically analyzed by Fisher’s exact test. PHENOTYPE:
|
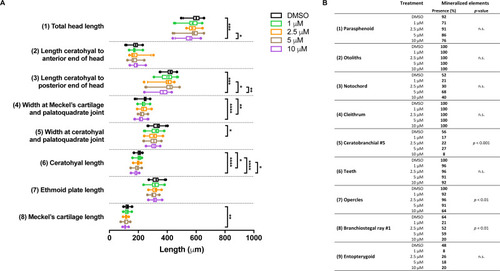
Morphometric analyses of cartilage and bone elements in 5 dpf wild type larvae treated with BGJ398 dissolved in DMSO (final DMSO concentration 0.1%) during 24–36 hpf.
(A) The length of the cartilage elements. The controls were exposed to only the vehicle, DMSO at a final concentration of 0.1% (n = 25). The group sizes of the 1, 2.5, 5 and 10 µM exposure were n = 24, 23, 22 and 25, respectively. Medians are represented by lines within the boxes; the boxes show interquartile ranges. Whiskers are drawn left to the 5th percentile and right to the 95th. Points beyond the 5–95 interval are drawn as individual dots. The mean is indicated by a “+” symbol. Data were statistically analyzed by non-parametric Kruskal–Wallis test. Asterisks indicate significant differences; ∗p < 0.05, ∗∗p < 0.01, ∗∗∗p < 0.001, ∗∗∗∗p < 0.0001. (B) Percentages of mineralized elements present in DMSO controls (n = 25), 1 µM (n = 24), 2.5 µM ( n = 23), 5 µM (n = 22) or 10 µM (n = 25) BGJ398. Data were statistically analyzed by Fisher’s exact test. |
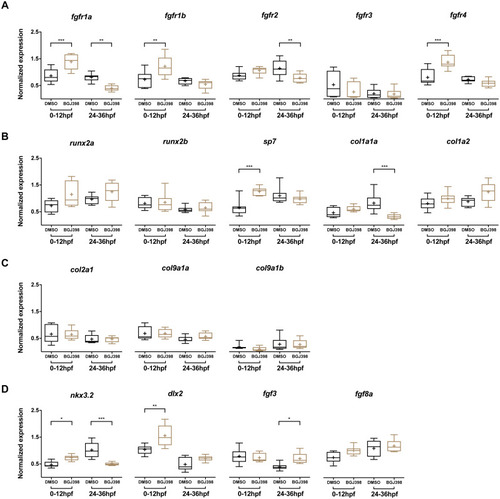
Relative expression levels in 5 dpf wild type zebrafish larvae treated with 5 µM of BGJ398.
Exposure windows were 0–12 and 24–36 hpf. Exposed fish (n = 8) were compared to a DMSO control (n = 8, final concentration 0.1%). (A) Expression of fgfr s showing differential expression in fgfr1a, fgfr1b, fgfr2 and fgfr4. (B) Expression of genes involved in bone formation. (C) Genes involved in cartilage formation. From col9a1b one outlier (p < 0.01 in Grubbs’ test) was removed. (D) Neural crest cell marker genes. All data are presented as box plots, with median represented by a line within the box; interquartile ranges by the boxes, 5–95 confidence intervals by whiskers and means indicated by “+” symbol. All the data were analyzed using a Kruskal–Wallis test followed by a Dunn’s multiple comparison test. Asterisks indicate significant differences; ∗p < 0.05, ∗∗p < 0.01, ∗∗∗p < 0.001. |