
Fig. 2
- ID
- ZDB-FIG-221120-3
- Publication
- Hayden et al., 2021 - Mathematical modeling of Erk activity waves in regenerating zebrafish scales
- Other Figures
- All Figure Page
- Back to All Figure Page
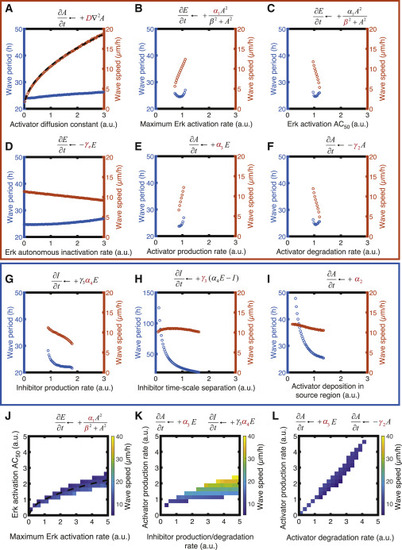
Figure 2. Parameter analysis and sensitivity. Wave speed and period varying the parameters of the model: D (A), α1 (B), β (C), γe (D), α3 (E), γ2 (F), α4 (G), γ3 (H), and α2 (I) individually and covarying α1/β (J), α3/α4 (K), and α3/γ2 (L). Parameters are expressed relative to the reference value in our standard simulation (see Table 1). Predicted dependencies in (A) and (J) are plotted as dashed black curves: (A) v = v0D1/2, where v0 = 11 μm/h is velocity for the standard set of parameters and D is expressed in relative units; (J) β = α11/2. Wave speed and period are calculated for regions of parameter space that feature periodic persistent waves. Orange box: parameters that affect mainly wave speed. Blue box: parameters that affect mainly wave period. Please note that γ1 and α4 together determine the action of the inhibitor by controlling its activity toward Erk and its levels, respectively. Thus, the dependencies of the wave period and speed on those parameters are identical, and the plot for γ1 was omitted. To see this figure in color, go online. |