
- Title
-
Mathematical modeling of Erk activity waves in regenerating zebrafish scales
- Authors
- Hayden, L.D., Poss, K.D., De Simone, A., Di Talia, S.
- Source
- Full text @ Biophys. J.

Figure 1. Model formulation and stability analysis. (A) Erk activity in regenerating scales in vivo, measured using an Erk kinase translocation reporter (Erk KTR). The Erk KTR sensor provides a proxy of Erk activity through measurement of its subcellular localization. The sensor contains both a nuclear localization signal and a nuclear export signal and preferentially localizes to the nucleus when unphosphorylated and to the cytoplasm when phosphorylated (41). Thus, a readout of Erk activity at cellular resolution is calculated by measuring the ratio of nuclear and cytoplasmic Erk KTR signals. The data shown were imaged and analyzed in (35). hpp, hours post plucking. (B) Schematics of theoretical model including a diffusible extracellular activator, Erk, and an inhibitor of Erk. Arrows between chemical species indicate feedback. (C) Numerical simulation of the dynamical system in the source region when diffusion is null. (D) Numerical simulation of the reaction-diffusion dynamical system. (E and F) Stability analysis of the system when diffusion is null. E: source region; F: outside the source region. Curves indicate pairwise intersections between nullcline surfaces. (G) Leading edge fixed-point analysis: nullclines in the leading edge of the wave, where the inhibitor is taken to be 0. Circles: fixed points at 4 h from simulation start (stability is indicated). Scale bars, 250 μm. a.u., arbitrary unit. To see this figure in color, go online. |
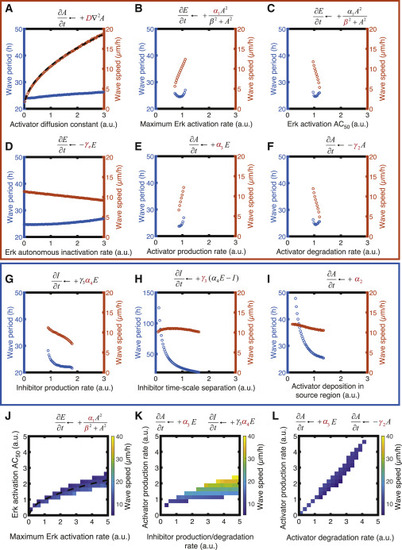
Figure 2. Parameter analysis and sensitivity. Wave speed and period varying the parameters of the model: D (A), α1 (B), β (C), γe (D), α3 (E), γ2 (F), α4 (G), γ3 (H), and α2 (I) individually and covarying α1/β (J), α3/α4 (K), and α3/γ2 (L). Parameters are expressed relative to the reference value in our standard simulation (see Table 1). Predicted dependencies in (A) and (J) are plotted as dashed black curves: (A) v = v0D1/2, where v0 = 11 μm/h is velocity for the standard set of parameters and D is expressed in relative units; (J) β = α11/2. Wave speed and period are calculated for regions of parameter space that feature periodic persistent waves. Orange box: parameters that affect mainly wave speed. Blue box: parameters that affect mainly wave period. Please note that γ1 and α4 together determine the action of the inhibitor by controlling its activity toward Erk and its levels, respectively. Thus, the dependencies of the wave period and speed on those parameters are identical, and the plot for γ1 was omitted. To see this figure in color, go online. |
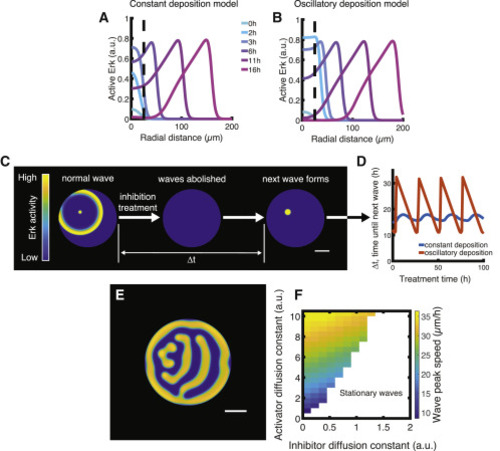
Figure 3. Variations in model type and assumptions. (A and B) Erk activity as a function of time in two models of wave generation at the source region. Dashed lines indicate the boundary of the source region. The standard model with a constant (A) or oscillatory (B) activator deposition in the source region is shown. (C and D) In silico Erk inhibition and recovery experiment. Pharmacological inhibition is implemented in our model by setting α1 to 0 for the duration of the treatment. (E and F) Alternative wave propagation model in which the Erk inhibitor diffuses. (E) Example of stationary pattern established after 200 h of simulation time. (F) Wave peak speed as a function of activator and inhibitor diffusion constants relative to value of the activator diffusion constant in the standard simulation. Scale bars, 250 μm. To see this figure in color, go online. |
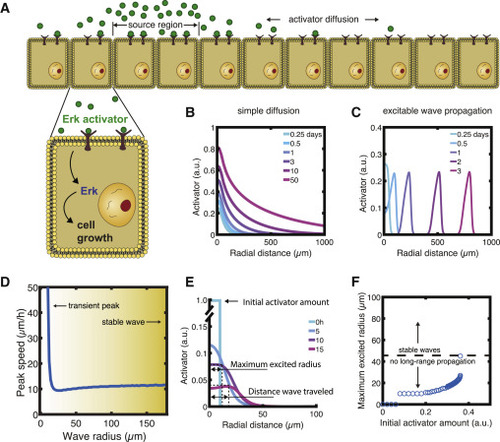
Figure 4. Consequences of activator diffusion constant and effects of curvature on wave propagation. (A) Schematics of activator gradient established by simple diffusion alone. (B and C) Activator gradient formation by simple diffusion (B) versus excitable wave propagation (C). (D) Wave speed as a function of radial distance from the source. (E) Definitions of wave profile characteristics. (F) Radius of the excited region for different initial activator amounts. Initial activator concentrations higher than ∼0.36 ET induced an excited radius above 45 μm and triggered wave propagation. To see this figure in color, go online. |