
FIGURE
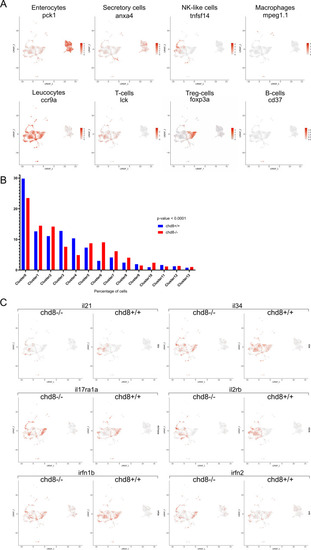
Figure S3.
- ID
- ZDB-FIG-221118-12
- Publication
- Hayot et al., 2022 - Loss of autism-candidate CHD8 perturbs neural crest development and intestinal homeostatic balance
- Other Figures
- All Figure Page
- Back to All Figure Page
Figure S3.
|
Expression Data
Expression Detail
Antibody Labeling
Phenotype Data
Phenotype Detail
Acknowledgments
This image is the copyrighted work of the attributed author or publisher, and
ZFIN has permission only to display this image to its users.
Additional permissions should be obtained from the applicable author or publisher of the image.
Full text @ Life Sci Alliance