
Figure 3.
- ID
- ZDB-FIG-221118-10
- Publication
- Hayot et al., 2022 - Loss of autism-candidate CHD8 perturbs neural crest development and intestinal homeostatic balance
- Other Figures
- All Figure Page
- Back to All Figure Page
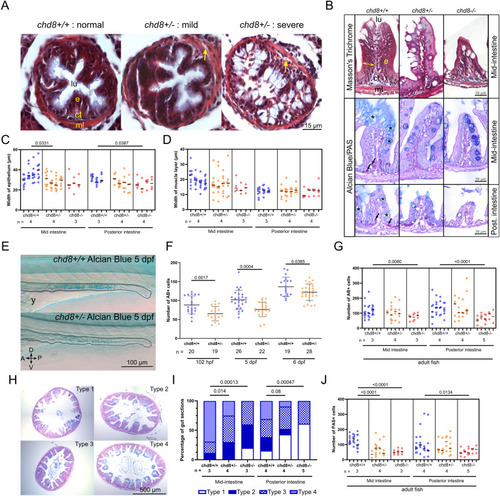
Altered intestinal architecture in chd8 heterozygous and homozygous mutants at larval and adult stages. (A) Representative images of intestinal cross sections of chd8+/+ and chd8 sa19827/+ zebrafish larvae at 5 days post-fertilization (dpf) that underwent Masson’s trichrome staining. Yellow arrows point to gaps between the epithelium and the muscle layers. (B) Representative images of cross sections of the mid- and posterior intestines of chd8+/+, chd8 sa19827/+, and chd8 sa19827/sa19827 adult zebrafish that underwent Masson’s trichrome and Alcian blue (AB)/periodic acid–Schiff (PAS) stainings. Black arrows point to PAS-positive cells, and black asterisks indicate AB-positive cells. (C) Dot plot of the measured width of the epithelium in the mid- and posterior intestines for each condition tested. (B) Width of the epithelium is shown by the yellow double arrowheads in (B). A nested t test was conducted between pairs of conditions. (D) Dot plot of the measured width of the muscle layers in the mid- and posterior intestines for each condition tested. A nested t test was conducted between pairs of conditions. (E) Representative lateral images of chd8+/+ and chd8 sa19827/+ zebrafish larvae at 5 dpf that underwent whole-mount AB staining. Dashed lines denote the intestinal margins. (F) Dot plot showing the number of AB-positive cells in the intestines of chd8+/+ and chd8 sa19827/+ zebrafish larvae at 5 dpf. A t test was conducted between pairs of conditions. (B, G) Dot plot showing the number of AB-positive cells, shown by black asterisks in (B), in the mid- and posterior intestines for each condition tested. A nested t test was conducted between pairs of conditions. (H) Representative images of intestinal cross sections of the mid-intestines of chd8+/+, chd8 sa19827/+, and chd8 sa19827/sa19827 adult zebrafish, stained with AB/PAS. The presence of mucus was scored based on four qualitative types: absence of mucus (type 1), mucus only present at the top border of the villi (type 2), presence of mucus in the intestinal lumen (type 3), and mucus present at the top of the villi and in the intestinal lumen (type 4). (H, I) Qualitative scoring of the presence of mucus in mid- and posterior intestines for each condition tested based on the types defined in (H). Fisher’s exact test was conducted. (B, J) Dot plot showing the number of PAS-positive cells, shown by black arrows in (B), in the mid- and posterior intestines for each condition tested. A nested t test was conducted between pairs of conditions. Each column in panels (C, D, G, J) corresponds to one fish, and each dot represents one tissue section (either an average of the five measurements for panel (C, D) or an absolute number of AB- and PAS-positive cells for panels (G, J), respectively). lu, lumen; e, epithelium; ct, conjunctive tissue; ml, muscle layers; A, anterior; P, posterior; D, dorsal; V, ventral; n, number of adult fish or larvae; and y, yolk. |
| Fish: | |
|---|---|
| Observed In: | |
| Stage Range: | Day 5 to Adult |