
Fig. 5
- ID
- ZDB-FIG-221101-16
- Publication
- Ulloa et al., 2021 - Definitive hematopoietic stem cells minimally contribute to embryonic hematopoiesis
- Other Figures
- All Figure Page
- Back to All Figure Page
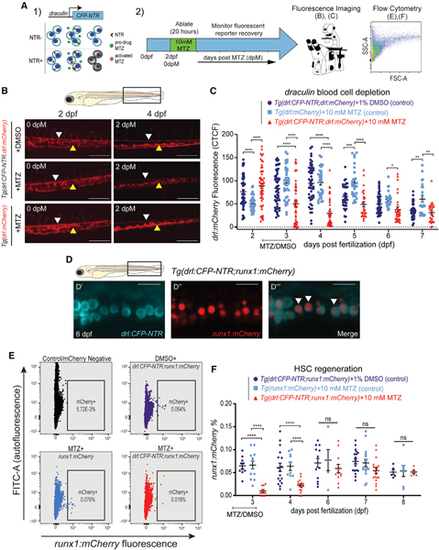
HSCs regenerate following their targeted depletion in early development
(A) Experimental schema of regeneration assay: (1) mechanism: drl promoter drives expression of a CFP-NTR (nitroreductase) transgene. NTR converts metronidazole (MTZ) into a toxic intermediate that triggers apoptosis of only drl:CFP-NTR-expressing cells; (2) timeline: Tg(drl:CFP-NTR) or control larvae were treated with 10 mM MTZ or 1% DMSO vehicle control for 20 h from 54–74 h post-fertilization (~2–3 dpf) to specifically target HSCs and were then monitored for their recovery using fluorescence imaging and flow cytometry. (B) Fluorescent images of Tg(drl:CFP-NTR+;drl:mCherry+) and Tg(drl:mCherry+) embryos treated with 10 mM MTZ or 1% DMSO (control) at 2 and 4 dpf (0 and 2 days post-MTZ [dpM], respectively). Arrowheads indicate remaining stationary (yellow) and circulatory (white) cells within the caudal hematopoietic tissue (CHT; boxed region in schematic of zebrafish larva, above). Scale bars, 500 μm. (C) Quantification of drl:mCherry CTCF levels in treated groups and control groups: (Tg(drl:CFP-NTR;drl:mCherry) + 1% DMSO (purple), Tg(drl:mCherry) + 10 mM MTZ (light blue); and Tg(drl:CFP-NTR;drl:mCherry) + 10 mM MTZ (red) (n = 17–54 larvae). (D) Confocal fluorescent images showing cytoplasmic drl:CFP-NTR expression (D′), nuclear runx1:mCherry expression (marking HSPCs) (D′′), and merged (D′′′) within the CHT of a 6 dpf zebrafish, with white arrowheads indicating double-positive cells. Scale bars, 500 μm. (E) Flow cytometry plots of runx1:mCherry and fluorescein isothiocyanate (FITC) (autofluorescence control) in untreated negative controls (black), Tg(drl:CFP-NTR;runx1:mCherry) + 1% DMSO, Tg(runx1:mCherry) + 10 mM MTZ; and Tg(drl:CFP-NTR;runx1:mCherry) + 10 mM MTZ. (F) Quantification of runx1:mCherry+ % from (E) flow cytometry experiments in treated and control groups. n = 5–19, 7–10 pooled larvae per sample. Two-way ANOVA with Tukey’s multiple comparisons test was used for all statistical analyses. Plots are individual points for each biological replicate with mean ± SEM. ****p ≤ 0.0001. See also Figure S5. |