
Fig. 3
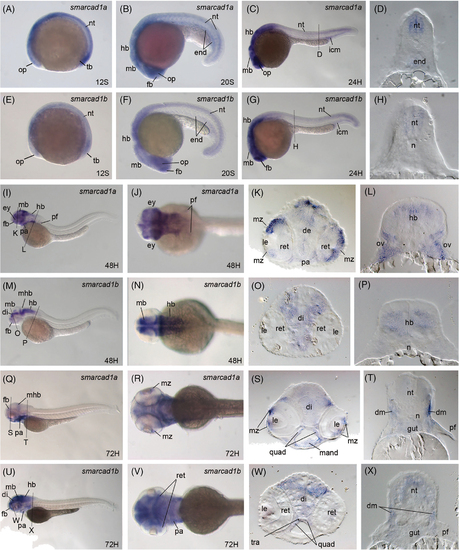
The two smarcad1 zebrafish genes are expressed in both overlapped and distinct regions during embryonic development. Whole-mount in situ hybridization of zebrafish embryos at stages 12S (A, E), 20S (B, F), 24 hpf (C, D, G, H), 48 hpf (I–P), and 72 hpf (Q–X). Anterior is to the left in all whole-mount images, and dorsal is to the top in all transverse sections. Gene names are labeled at the upright corner in the panels of whole-mount images. (A–D, I–L, and Q–T): gene expression of smarcad1a. (E–H, M–P, and U–X): gene expression of smarcad1b. (A and C) Lateral view of the expression of smarcad1a at 12S, 20S, and 24dpf, respectively. (D) Transverse section through the trunk region of the embryos in panel C. smarcad1a is mainly expressed in the neural tissues, endoderm, and intermediate cell mass at these stages. (E and G) Lateral view of the expression of smarcad1b at 12S, 20S, and 24dpf, respectively. (H) Transverse section through the trunk region of the embryos in panel G. The expression patterns of smarcad1b are very similar to smarcad1a at these early stages. (I, J) Lateral and dorsal view of the expression of smarcad1a at 48 hpf. (K and L) Transverse section through the head and pectoral fin regions. (M and N) Lateral and dorsal view of the expression of smarcad1b at 48 hpf. (O and P) Transverse section through the head and pectoral fin regions. (Q and R) Lateral and dorsal view of the expression of smarcad1a at 72 hpf. (S and T) Transverse section through the head and pectoral fin regions. (U and V) Lateral and dorsal view of the expression of smarcad1b at 72 hpf. (W and X) Transverse section through the head and pectoral fin regions. The dashed lines indicate the positions of sections. The letters below the dashed lines correspond to the panels. de, diencephalon; dm, dermomyotome; end, endoderm; fb, forebrain; hb, hindbrain; icm, intermediate cell mass; ir, iris; le, lens; mand, mandibular cartilage; mb, middle brain; mhb, midbrain-hindbrain boundary; mz, ciliary marginal zone; n, notochord; nt, neural tube; op, optical cup; pf, pectoral fin; pa, pharyngeal; quad, quadrate cartilage; ret, retina; tb, tail bud |
| Genes: | |
|---|---|
| Fish: | |
| Anatomical Terms: | |
| Stage Range: | 10-13 somites to Protruding-mouth |