
Fig. 7
- ID
- ZDB-FIG-221018-216
- Publication
- Yong et al., 2021 - SNX27-FERM-SNX1 complex structure rationalizes divergent trafficking pathways by SNX17 and SNX27
- Other Figures
- All Figure Page
- Back to All Figure Page
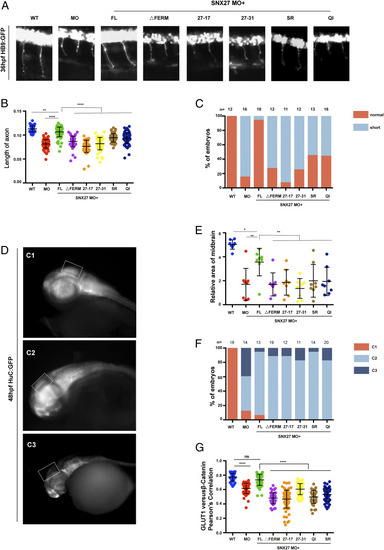
The SNX1–SNX27 interaction is critical for neuronal growth and brain development in zebrafish. (A) Morphology of CaP axons from embryos at 36 hours postfertilization (hpf) injected with SNX27a MO and/or indicated mRNAs was determined, and representative images of at least three independent experiments were shown. All injections were performed at one-cell stage of the Tg [hb9: GFP]ml2 transgenic zebrafish embryos. (B) Statistical analysis of the length of CaP axons in embryos described as in A; each dot represents one CaP axons length in embryos, and error bars indicate the SD. The samples were measured using at least 55 axons from 11 embryos. P values were calculated using one-way ANOVA by Tukey’s honestly significant difference (HSD) test or t test. ****P < 0.0001; ***P < 0.001; **P < 0.01. (C) The proportion of each class upon injection of SNX27a MO only or coinjection of indicated mRNAs is shown. All injections are performed at one-cell stage of the development. The length of the axons is divided into two grades, normal and short. Normal means the length of axon is similar to that of WT, whereas short means the length of axon is shorter than that of WT. N represents the number of embryos used for statistical analysis. (D) HuC expression in Tg(HuC:GFP) transgenic zebrafish. The lateral view of zebrafish midbrain at 48 hpf was divided into three levels according to the size of midbrain area. C1, normal; C2, moderate defects in midbrain; C3, severe defects in midbrain. All injections were performed at the one-cell stage of development. The white squares label the position of the midbrain. Representative images of three independent experiments were shown. (E) The relative area of zebrafish midbrain was measured from lateral view. Eight embryos from each group were used for analysis. Results for individual zebrafishes were plotted, and the mean and SD for each group are shown; P values were calculated using one-way ANOVA by Tukey’s HSD test or t test. **P < 0.01; *P < 0.1. (F) The percentage of embryos in each class described in D and E are shown. N represents the numbers of embryos used for statistical analysis. P value was calculated using χ2 (and Fisher’s exact) test. P < 0.0001. (G) Colocalization analysis of GLUT1 with β-catenin within zebrafish. Results for individual zebrafish embryo cells are plotted, along with the mean and SD for each group. P values were calculated using one-way ANOVA by Tukey’s HSD test or t test. ****P < 0.0001, ns, not significant. |
| Fish: | |
|---|---|
| Knockdown Reagent: | |
| Observed In: | |
| Stage Range: | Prim-25 to Long-pec |