
Fig. 2
- ID
- ZDB-FIG-220927-87
- Publication
- Naylor et al., 2022 - A novel nanoluciferase transgenic reporter measures proteinuria in zebrafish
- Other Figures
- All Figure Page
- Back to All Figure Page
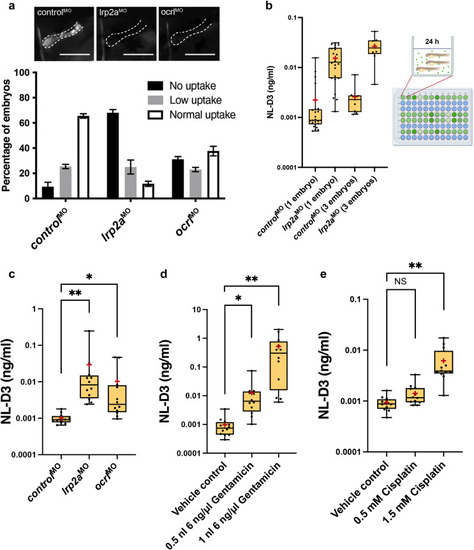
Figure 2. NL-D3 zebrafish can be used to assay proximal tubule dysfunction. (a) The top panels show close-up lateral views of pronephric proximal tubules after indicated treatments and 1–2 hours after dextran injection. Bar = 100 μm. The bar chart at the bottom shows the level of uptake of a 10 kDa fluorescent dextran in control (n = 40), lrp2a (n = 39), and ocrl (n = 42) morphant zebrafish embryos. (b) The box and whisker plot showing NL-D3 levels detected in controls and lrp2a morphants incubated as 1 embryo per well (n = 24) or 3 embryos per well (n = 9). The schematic showing the experimental setup for the NL-D3 zebrafish embryos; each 96-well plate was assessed for luminescence on a luminometer. (c) The box and whisker plot showing the amount of NL-D3 detected in the embryo medium in control (n = 12), lrp2a (n = 12), and ocrl (n = 12) morphants. (d) The box and whisker plot showing the amount of NL-D3 detected in the embryo medium in vehicle control (dimethylsulfoxide) and 2 volumes of injected gentamicin (n = 12 for each assay). (e) The box and whisker plot showing the amount of NL-D3 detected in the embryo medium in control and 2 concentrations of cisplatin (n = 12 for each assay). For box and whisker plots in (b)–(e), median is shown as a line and mean is shown as a red cross-hair. ∗P ≤ 0.05; ∗∗P ≤ 0.01. NS, not significant. |
| Fish: | |
|---|---|
| Conditions: | |
| Knockdown Reagents: | |
| Observed In: | |
| Stage Range: | Protruding-mouth to Day 4 |