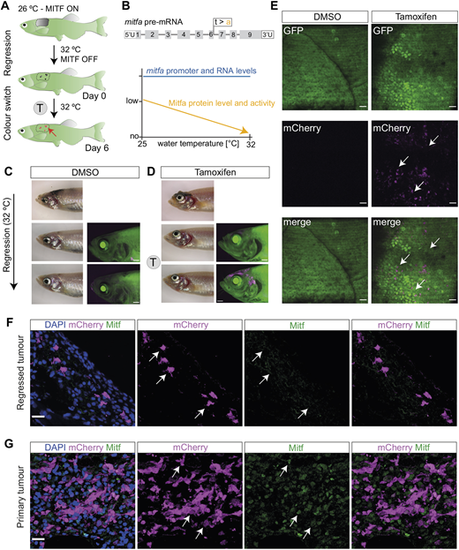
Successful GFP-to-mCherry fluorophore switch in persister cells. (A) Schematic representation of the experimental workflow of tamoxifen (T) treatment following melanoma regression. The red arrow points to the location of recombined melanoma persister cells at MRD site. (B) Overview of mitfavc7 mutant controlling Mitfa activity. (Top) Schematic of mitfa pre-RNA with the location of vc7 mutation at the end of exon 6. (Bottom) Graphical overview of the effect of mitfavc7 mutation on Mitfa protein level and activity (orange) at increasing water temperatures. Mitfa protein and activity levels decrease with increasing water temperature, unlike the mitfa RNA levels, which remain expressed (blue). Schematic adapted from Travnickova et al. (2019). This image is not published under the terms of the CC-BY license of this article. For permission to reuse, please see Travnickova et al. (2019). (C) A representative image of a control fish with no mCherry+ cells detectable at the MRD site without tamoxifen treatment (top). Following melanoma regression and subsequent treatment with DMSO (0.04% at 31-32°C) there is no green-to-red recombination in the melanoma MRD (bottom row) compared to pre-treatment (middle row). Scale bars: 1 mm, N=3 fish. (D) A representative image of a tamoxifen-treated fish with newly ‘switched’ mCherry+ cells (magenta) detectable at the MRD site (top). Following melanoma regression and subsequent treatment with tamoxifen (4 µM, at 31-32°C) there is specific green-to-red recombination in the melanoma MRD (bottom row) compared to pre-treatment (middle row). Scale bars: 1 mm, N=3 fish. (E) STD projections of confocal z-stack acquisitions showing MRD sites in fish treated with DMSO or tamoxifen. White arrows indicate clusters of mCherry+ cells present only in tamoxifen-treated condition. Scale bars: 50 µm, N=3 fish. (F) Melanoma cells at the MRD site express mCherry, but lack Mitfa protein (white arrows). STD projections of confocal z-stack acquisitions of immunofluorescence staining of the tamoxifen-treated MRD with antibodies for mCherry and Mitfa proteins and with DAPI nuclear staining. Scale bar: 15 µm. (G) Melanoma cells in the primary tumour express both mCherry and Mitfa protein (white arrows). STD projections of confocal z-stack acquisitions of immunofluorescence staining of the tamoxifen-treated primary tumour, showing staining of mCherry and Mitfa proteins with DAPI nuclear staining Scale bar: 15 µm. See also Fig. S2.
|
