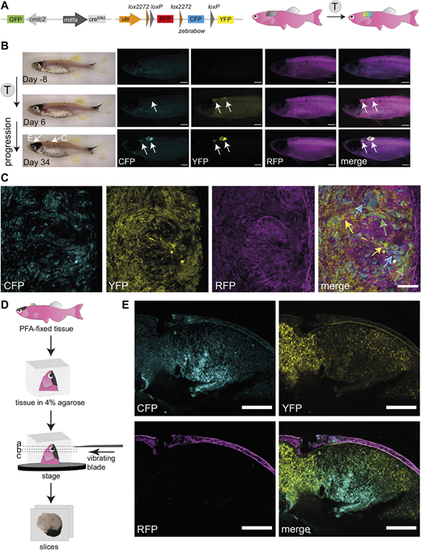
Successful fluorophore switch using the zebrabow system in adult zebrafish primary melanoma following tamoxifen treatment. (A) A schematic of mitfa:creERt2 and ubi:zebrabow constructs (Pan et al., 2013), which enables recombination from red signal (RFP) to a stochastic combination of cyan (CFP), yellow (YFP) and red (RFP) signal in mitfa:creERt2-expressing cells after tamoxifen (T) treatment. The cmlc2 promoter drives GFP expression and facilitates screening for the creERt2 line based on GFP+ heart myocardium. (B) Multicolour labelling in adult zebrafish melanomas. An adult zebrafish with two primary melanomas 8 days before the tamoxifen treatment course (top), and 6 days (middle) and 34 days (bottom) after the start of the treatment. Increasing de novo expression of CFP and YFP proteins in both pigmented and unpigmented tumours can be detected after tamoxifen treatments (4 µM). N=3 fish, scale bars: 1 mm, white arrows point to two tumour locations. The arrows on the brightfield image (Day 34) point to the melanomas shown in panels C and E, respectively. (C) Confocal multicolour imaging of zebrafish melanoma. Single z-plane of confocal acquisition of tamoxifen-treated fish shows individual cells acquiring varied combinations of CFP, YFP and RFP (blue, green and yellow arrows on merged image, respectively). N=3 fish, scale bar: 100 µm. (D) Overview of the vibratome sectioning protocol. The PFA-fixed tissue is mounted in 4% agarose and cut using a vibrating blade into 400 µm-thick sections to capture the pigmented tumour (E). (E) Vibratome section imaging of a tamoxifen-treated fish (tissue location as shown in B). Clusters of CFP, YFP or double-expressing cells are clearly visible in areas of the pigmented tumour. STD projections of confocal z-stacks of a PFA-fixed sectioned tissue. N=3 fish, scale bars: 200 µm. See also Fig. S1B-D.
|
