|
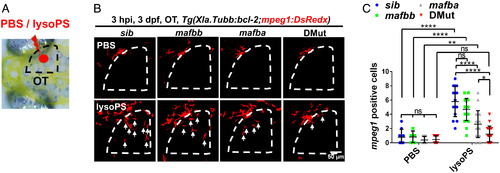
Macrophages in DMut do not respond to lysoPS. (A) Schematic diagram indicates the PBS/lysoPS injection region. (B) Representative images of recruited macrophages in the optic tectum (OT) region in PBS/lysoPS-injected siblings, mafba mutants, mafbb mutants, and DMut embryos in Tg(Xla.Tubb:bcl-2;mpeg1:DsRedx) double-transgenic background. Macrophages are labeled in red color. Dashed lines indicate the optic tectum region. Arrows represent recruited macrophages in the OT. hpi, hours post injection. (C) Quantification of recruited macrophage number in the OT region in PBS/lysoPS-injected siblings (n = 9 for PBS or 15 for lysoPS), mafba mutants (n = 8 for PBS or 18 for lysoPS), mafbb mutants (n = 5 for PBS or 21 for lysoPS), and DMut embryos (n = 9 for PBS or 18 for lysoPS) in Tg(Xla.Tubb:bcl-2;mpeg1:DsRedx) double-transgenic background (mean ± SD; two-way ANOVA; nonsignificant [ns] P > 0.05, *P < 0.05, **P < 0.01, ****P < 0.0001).
|