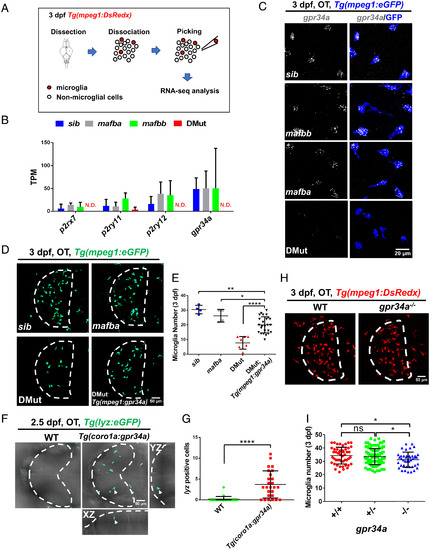
Gpr34a is a downstream target of Mafba and Mafbb and promotes microglia colonization. (A) Workflow of microglia isolation from the brains of 3 dpf siblings, mafba mutants, mafbb mutants and DMut for transcriptomic analysis. (B) Expression level of p2rx7, p2ry11, p2ry12, and gpr34a in siblings, mafba mutants, mafbb mutants, and DMut embryos in RNA-seq data. n = 3 for each group. TPM, transcript per million. N.D., not detected. (C) Representative images of gpr34a RNAscope (gray) and anti-GFP antibody staining (blue) in the optic tectum (OT) of 3 dpf siblings, mafba mutants, mafbb mutants, and DMut in Tg(mpeg1:eGFP) transgenic background. (D) Representative images of microglia in the OT region in 3 dpf siblings, mafba mutants, DMut embryos, and DMut;Tg(mpeg1:gpr34a) transgenic embryos. Microglia are labeled in green color in Tg(mpeg1:eGFP) transgenic background. Dashed lines indicate the OT region. (E) Quantification of microglia number in the OT region in 3 dpf siblings (n = 4), mafba mutants (n = 4), DMut embryos (n = 8), and DMut;Tg(mpeg1:gpr34a) transgenic embryos (n = 25) in Tg(mpeg1:eGFP) transgenic background (mean ± SD; Student’s t test; *P < 0.05, **P < 0.01, ****P < 0.0001). (F) Representative images of neutrophils in the OT region in 2.5 dpf wild-type (WT) and Tg(coro1a:gpr34a) transgenic embryos. Neutrophils are labeled in green color. Dashed lines indicate the OT region. White arrow indicates a neutrophil located in the OT. (G) Quantification of neutrophils in the OT region in 2.5 dpf WT (n = 23) and Tg(coro1a:gpr34a) transgenic embryos (n = 26) (mean ± SD; Student’s t test; ****P < 0.0001). (H) Representative Images of microglia in the OT in 3 dpf WT and gpr34a mutants in Tg(mpeg1: DsRedx) transgenic background. Microglia are labeled in red color. Dashed lines indicate the OT region. (I) Quantification of microglia number in the OT in 3 dpf WT (n = 49), gpr34a heterozygous embryos (n = 124), and gpr34a mutants (n = 41) in Tg(mpeg1: DsRedx) transgenic background (mean ± SD; Student’s t test; nonsignificant [ns] P > 0.05; *P < 0.05).
|
