
Fig. 4
- ID
- ZDB-FIG-220812-4
- Publication
- Rajan et al., 2022 - Evolutionary divergence of locomotion in two related vertebrate species
- Other Figures
- All Figure Page
- Back to All Figure Page
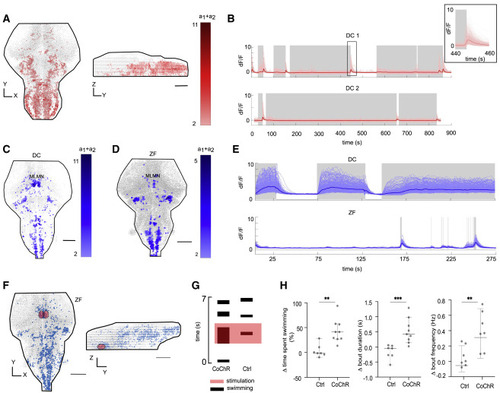
Figure 4. Neurons correlated with termination of swimming (in DC) and swimming (in DC and ZF); and holographic stimulation of the identified mesencephalic locomotion maintenance neurons (MLMNs) (A) Representative images of stop cells (in red) identified in the DC hindbrain (N = 3 fish). (B) The activity of the identified stop neurons (in red) with respect to swimming activity (in gray). The inset shows a magnified region around a swim termination event. (C and D) A representative figure of a maximum projection of neuronal correlates of swimming (in blue) identified in the DC and ZF brain, respectively. The nuclei correlated with swimming appear to be conserved between DC (N = 4 fish) and ZF (N = 4 fish). The MLMN population is labeled. (E) Neuronal activity of all the swimming correlated neurons in DC compared with the corresponding neurons’ activity in a ZF for a duration of 300 s. The activity in the conserved nuclei in DC is sustained for long durations unlike ZF, correlating with their long swim events. The gray shaded regions represent active swimming. (F) The region of interest (ROI) for holographic optogenetic stimulation is illustrated. MLMN population described in (C and D) was first anatomically located under a 2-photon microscope using expression of CoChR-GFP (in test) or GCaMP6 (in control) as the guidance cue. A holographic stimulation protocol was then employed in this ROI (see Figures S4A–S4C). (G) The result of the stimulation in a CoChR and Ctrl fish. Swimming activity in CoChR fish is increased during the holographic stimulation. (H) Change in total swimming time, bout duration, and bout frequency during optogenetic stimulation. The time spent swimming is prolonged in test fish by the optogenetic stimulation; this increase is caused by both, an increased recruitment of bouts and an increase in the duration of the bouts. N = 7 Ctrl ZF and 9 CoChR ZF. ∗∗p < 0.01, ∗∗∗p = 0.001; Mann-Whitney test. All error bars show 95% confidence interval. Scale bars, 100 μm. See also Figures S3 and S4. |