
Fig. 2
- ID
- ZDB-FIG-220812-2
- Publication
- Rajan et al., 2022 - Evolutionary divergence of locomotion in two related vertebrate species
- Other Figures
- All Figure Page
- Back to All Figure Page
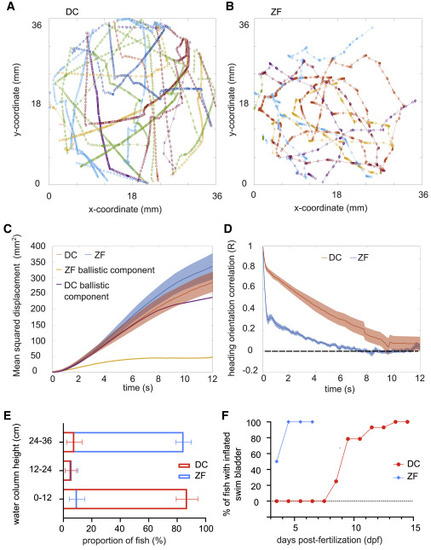
Figure 2. Long-term exploratory kinematics of DC and ZF (A and B) A few tens of swim trajectories depicted in different colors from a single DC and ZF larva, respectively. (C) Mean squared displacement (MSD) in DC and ZF over time. The MSD over time for the ballistic component of DC and ZF is also overlapped on the plot. N = 23 DT and 37 ZF. The error bars show SEM. (D) Decorrelation in heading persistence over time. R = 1 indicates a perfect persistence in head direction, whereas R = 0 corresponds to a dull randomization. In ZF, R drops rapidly, whereas this drop happens over longer period of time in DC. Hence, exploratory swimming in DC has a longer ballistic phase. N = 23 DT and 37 ZF. The error bars show SEM. (E) DC larvae occupy the bottom of the water column, whereas ZF larvae occupy the top. N = ∼30 fish and n = 10 readings in 3 replicates for each fish species. The error bars show 95% confidence interval. (F) Swim bladder inflation in ZF occurs earlier than in DC. The inflation of swim bladder in ZF occurs by ∼ 4–5 dpf, whereas DC inflates their swim bladder between ∼10 and ∼15 dpf. Sampled from a growing population of approximately N = 30 DC and 30 ZF. See also Figures S2. |