
Fig. 5
- ID
- ZDB-FIG-220809-65
- Publication
- Gao et al., 2022 - In Vivo Photocontrol of Microtubule Dynamics and Integrity, Migration and Mitosis, by the Potent GFP-Imaging-Compatible Photoswitchable Reagents SBTubA4P and SBTub2M
- Other Figures
- All Figure Page
- Back to All Figure Page
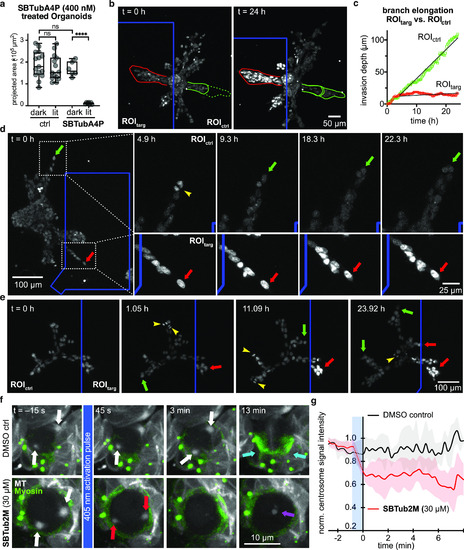
Spatiotemporal control over MT architecture, migration, and mitosis in 3D culture and tissue explant. (a) 3D human mammary gland organoids embedded in collagen gels only have inhibited branch outgrowth when treated with both SBTubA4P and UV pulses. (b) Local applications of UV light to ROItarg regions of SBTubA4P-treated organoids (blue box, one ca. 450 ms pulse per 7 min per z-stack) stops branch proliferation and outgrowth (red outline), while branches in untargeted ROIctrl regions develop dramatically (start: solid green line, final: dotted green line) (related to Movie S4). (c) Radial progress of branch tip fronts (directed and collective behavior) in ROItarg and ROIctrl regions. (d) Still image timecourse, zoomed on a branch tip in the ROIctrl (blue box) region, showing cell proliferation (yellow arrowhead) and matrix invasion (one representative of the migrating cells is tracked over time with green arrows), while branch tip of ROItarg region has static non-proliferating cells and even slight branch retraction (red arrows) (data related to Movie S5). (e) Branch progression and proliferation are unimpeded and continuous in ROIctrl regions, while ROItarg regions are static, and branches growing into the ROItarg stop their growth (color code as in (e), data related to Movie S6). [(a–e) Cell location in organoids tracked with nuclear stain SiR-DNA imaged at 647 nm]. (f) Whole-field-of-view 405 nm photoactivation of SBTub2M-treated intact 3D brain explants of larval Drosophila melanogaster (bottom row) causes neuroblast centrosomes (red arrows) to rapidly shrink in size and signal intensity (45 s and 3 min) and prevents the cell from progressing through division (13 min). Some MT signal accumulates at mid-cell at later time points (purple arrow) (data related to Movie S8). In DMSO-only controls (top row), centrosome integrity (white arrows, 45 s and 3 min) and progression through the cell cycle (13 min) are unaffected, indicated by myosin accumulation at the cleavage furrow (cyan arrows) (data related to Movie S9). [MTs in white (Jupiter::mCherry imaged at 561 nm), myosin in green (Squash::GFP imaged at 488 nm)]. (g) Relative mCherry fluorescence intensity of centrosomal ROIs in SBTub2M-treated prophase neuroblasts (red) after activation at 405 nm drops notably during the approximately 45 s activation period (blue box) compared to the DMSO control prophase neuroblasts (black). Signal intensities are shown as the proportion of the per-cell maximum preactivation signal intensity (shading indicates ±1 standard deviation, 1–2 centrosomes quantified from a total of five neuroblasts from three different animals). For details, see the Supporting Information. |