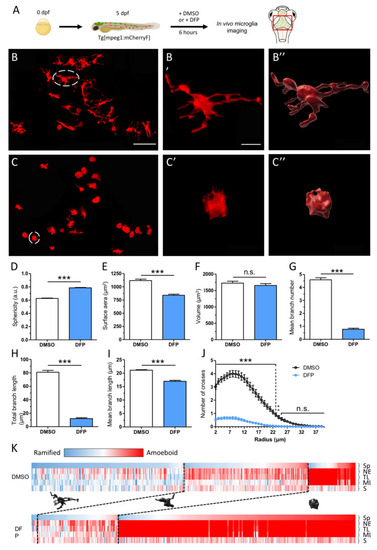
DFP exposure induced major morphological changes of microglial cells. (A) Scheme of the experimental set up. Live 5 dpf Tg[mpeg1:mCherryF] larvae were exposed to either 1% DMSO (control) or 15 µM DFP for 6 h and then imaged with a confocal microscope. The region of interest is framed in red. (B–C) Representative microglial cells in control (B) and DFP-treated larvae. (C) Scale bar: 50 µm. (B′,B″) Magnification of the white-circled microglia from a control larva (B′), and corresponding 3D reconstruction (B″). (C′,C″) Magnification of the white-circled microglia from a DFP-treated larva (C′), and corresponding 3D reconstruction (C″). Scale bar: 10 µm. (D–I) Changes in microglia morphological parameters: sphericity (Sp) (scaled from 0, fully disordered morphology, to 1, perfect sphericity) (D), surface area (S) (E), volume (V) (F), mean branch number (NB) (G), total branch length (TL) (H), and mean branch length (ML) (I) in control (DMSO) (N = 13 embryos, n = 327 cells) and DFP-treated larvae (DFP) (N = 14 larvae, n = 294 cells). (J) Sholl analysis of microglia branch complexity in control (black) and DFP-exposed larvae (blue). Error bars on all graphs represent the standard error of the mean (SEM). Statistics: ***, p < 0.001; n.s., not significant. (K) Clustering of microglial cell populations in control (DMSO) and DFP-exposed larvae (DFP), using five of the previously described morphological parameters (Sp, NB, TL, ML, and S) (see Materials and Methods). Each column corresponds to a single microglial cell, and each parameter is scaled from black (‘resting’ state) to red (‘activated’ state); black dotted lines separate the different microglial populations (ramified, transitional, and amoeboid).
|
