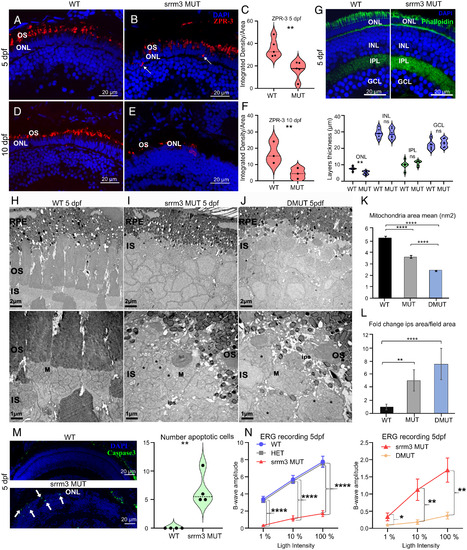
PR degeneration and visual impairment in srrm3 mutants. (A–F) ZPR-3 staining in WT (A and D) and srrm3 homozygous mutants (MUT) (B and E) siblings at 5 and 10 dpf. Arrows show rhodopsin mislocalization. n = 5 for 5 dpf and n = 3 for 10 dpf fish. Quantifications of the ZPR-3+ area are provided for 5 dpf (C) and 10 dpf (F). P values from unpaired t tests. (G) Phalloidin staining in WT and srrm3 MUT retinae. The violin plot shows a thickness analysis for different retina layers: inner nuclear layer (INL), inner plexiform layer (IPL), and ganglion cell layer (GCL); n = 6. P values from unpaired t tests. (H–J) Electron microscopy images show absence of OSs or a dramatic OS length decrease in eyes of both srrm3 MUT (I) and DMUT (J) compared to WT ones (H) at 5 dpf; n = 2 for all the genotypes. Further magnification in the Lower panels (H–J) revealed smaller mitochondria (asterisks indicate mitochondria in fission process) and enlarged interphotoreceptor space (ips), quantified as mean of mitochondria area per field and interphotoreceptor space area normalized on field area, represented as fold-change (FC) in K and L, respectively. P values from one-way ANOVA tests with Tukey post hoc analyses. (Scale bars, 2 μm, Upper, and 1 μm, Lower.) n ≥ 4 eyes per genotype; n ≥ 13 fields per genotype were analyzed. (M) Caspase3 staining and associated quantifications in 5 dpf retina sections. n = 4 for each genotype. (N) Averaged ERG b-wave amplitudes from WT, srrm3 HET, and srrm3 MUT, or srrm3 MUT and DMUT at 5 dpf upon different light stimuli (1%, 10%, and 100%). All recordings were done in two independent experiments. n = 20 for WT, n = 34 for srrm3 HET, n = 17 for srrm3 MUT (N), n = 22 for srrm3 MUT (O), and n = 15 for DMUT. P values from one-way ANOVA tests. Error bars correspond to the SEM. Significance code for all tests: ****P = 0; ***, 0 < P < 0.001; **, 0.001 ≤ P < 0.01; *, 0.01 ≤ P < 0.05.
|
