
Fig. 2
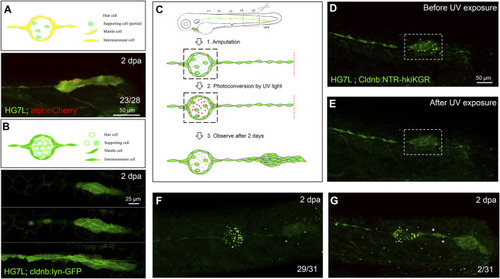
Interneuromast cells are the origin of clustering cells post–fin amputation. We performed fin amputation on double transgenic larvae from the cross of the Et(HG7L) with the Tg(−4.7alpl:mCherry) (alpl:mCherry) or Tg (−8.0cldnb:lyn-GFP) (cldnb:lynGFP) to track the origin of progenitor cells for the regenerating cluster post fin amputation at 2 days after amputation (2 dpa). (A) The regenerating cluster of fin-amputated larvae of Et(HG7L) X Tg (−4.7alpl: mCherry) line was examined at GFP or mCherry channel and photographed under confocal microscopy. A representative superimposed image from both channels is shown. The regenerating cluster image contains mostly yellow signals. As illustrated in the cartoon, the clustering cells could be originated from both interneuromast cells (INCs) and mantle cells (MCs). (B) The regenerating cluster of fin-amputated larvae of Et(HG7L) X Tg (−8.0cldnb: lyn-GFP) was examined at the GFP channel to scan the Z-axis. Images at three different z positions clearly show the existence of both membrane and cytosol green fluorescence. As illustrated in the cartoon, the signals could be originated from INCs, MCs, and supporting cells. (C) A series of cartoons shows utilizing a Tg(−8.0cldnb:NTR-hKikGR;myl7:EGFP) transgenic line, which expresses nitroreductase (NTR) and hKikGR fusion protein, to further discern whether the clustering cells are from INCs or cells inside a neuromast. To label the lateral line, we used larvae from the cross of Et(HG7L) (green) and Tg(−8.0cldnb:NTR-hKikGR;myl7:EGFP) (green dots), examined and photographed at the GFP channel before (D) and after UV exposure (E). After UV exposure, the green hKikGR dots were converted to red in all cell types, including MCs within distal neuromast right after fin amputation. (F) At 2 dpa, labeled cells generated new green hKikGR proteins. As shown in (F), the mingling of green and red signals becomes yellow. The labeled cells within the neuromasts rarely escaped in most treated larvae (29/31). However, we observed that a few larvae (2/31) showed yellow signals in the neighboring of INCs (white asterisks), as shown in (G). |