
Fig. 5
- ID
- ZDB-FIG-220720-29
- Publication
- Garcia et al., 2022 - Agonists of prostaglandin E2 receptors as potential first in class treatment for nephronophthisis and related ciliopathies
- Other Figures
- All Figure Page
- Back to All Figure Page
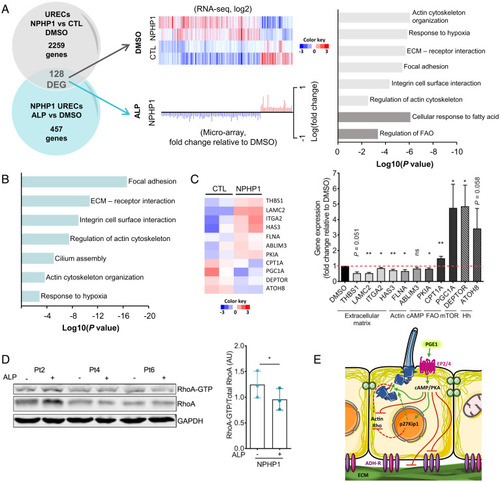
Transcriptomic analyses of molecular targets upon ALP treatment in NPHP1 URECs. (A, Left) Venn diagram shows the number of significantly DEGs detected by microarray in URECs derived from NPHP1 patients (NPHP1) and CTL individuals upon ALP treatment versus DMSO (457 regulated genes) in comparison to the number of dysregulated genes detected by RNA-seq in NPHP1 vs. CTL URECs (2,259 regulated transcripts). The 128 genes regulated by ALP inversely modulated in NPHP1 URECs (128 DEG) are underlined. (Center, Upper) Heatmap of the 128 DEGs from the RNA-seq dataset of NPHP1 (n = 2) and CTL (n = 2) URECs using signal log ratio values. Each row represents a gene with up- (red) and down-regulated (blue) expression. (Center, Lower) Fold-change and normalized expression of the 128 DEGs in one NPHP1 UREC (Pt1) selected from the microarray dataset. n = 3 experiments. (Right) Pertinent down- (light gray) or up-regulated (dark gray) pathways or relevant processes involving these genes were highlighted using Metascape. (B) Pertinent pathways or processes involving ciliary modulators dysregulated in NPHP1 URECs upon ALP treatment were highlighted using Metascape. (C, Left) Heatmap of 11 selected genes of the 128 DEGs from RNA-seq dataset of NPHP1 versus CTL URECs. (Left) qRT-PCR validating the positive effect of ALP treatment on the expression of the 11 selected dysregulated genes in NPHP1 URECs (n = 5). Paired Student’s t test: **P < 0.01, *P < 0.05, ns: not significant. Bars indicate mean ± SEM. n = 2 experiments. Hh: Hedgehog. (D, Left) Representative image of Western blot analysis showing the activation of RhoA in NPHP1 URECs (Pt, n = 3) after 24 h of treatment with DMSO (0.04%) or ALP (2 µM). (Right) Quantification of the relative abundance of RhoA-GTP in NPHP1 URECs. Each dot represents one individual cell line. Mean ± SEM. n = 3 experiments. (E) Pathways regulated by ALP/PGE1 in URECs. ADH-R, adhesion receptors. (C and D) Paired Student’s t test: **P < 0.01, *P < 0.05, ns: not significant. |