
Fig. 2
- ID
- ZDB-FIG-220720-26
- Publication
- Garcia et al., 2022 - Agonists of prostaglandin E2 receptors as potential first in class treatment for nephronophthisis and related ciliopathies
- Other Figures
- All Figure Page
- Back to All Figure Page
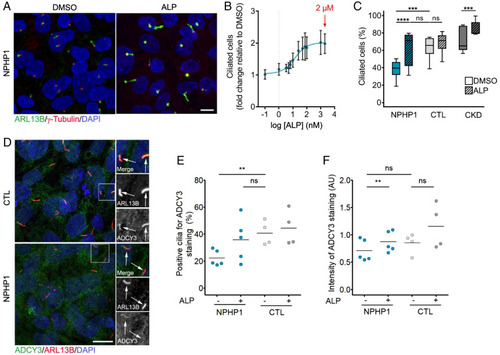
Validation of prostaglandin signaling as a target in NPHP1-defective renal cells. (A) Representative images of immunofluorescence of primary cilia (ARL13B, green), basal bodies (γ-Tubulin, red), and nuclei (DAPI, blue) in NPHP1 URECs 5 d after seeding treated for 2 d with DMSO (0.04%) or ALP (2 µM). (Scale bars, 10 µM.) (B) Quantification of ciliogenesis in one NPHP1 UREC (Pt1) exposed for 2 d to increasing concentrations of ALP. Mean ± SEM n = 2 to 4 experiments. Nonlinear regression. (C) Quantification of ciliogenesis in URECs derived from NPHP1 patients (NPHP1, n = 11), CTL individuals (n = 6), and CKD patients (n = 5) exposed for 2 d to DMSO (0.04%) and ALP (2 µM). Results are expressed as the mean for all individual categories and are shown using a box-and-whisker plot. n = 1 to 15 experiments per cell line (mean of 3.5 experiments per cell line). Mixed linear-regression model with quasibinomial penalization taking into account the correlation of observations coming from the same individuals using a random effect on the cell line: ***P < 0.001, ****P < 0.0001, ns: not significant. (D) Representative images of immunofluorescence of ADCY3 (green), primary cilia (ARL13B, red), and nuclei (DAPI, blue) in NPHP1 and CTL URECs. Arrows indicate ARL13B+ cilia. (Scale bars, 10 µM.) (E and F) Quantification of the percentage of ADCY3+ cilia (E) and of the intensity of ADCY3 in those cilia (F) in NPHP1 (n = 5) and CTL (n = 4) URECs 5 d after seeding treated for 2 d with DMSO (0.04%) or ALP (2 µM). Each dot represents one individual cell line. Bars indicate mean. n = 3 experiments. Mixed linear-regression model with quasibinomial penalization (E), Mann–Whitney U test (NPHP1 vs. CTL) and paired Student’s t test (DMSO vs. ALP) (F): **P < 0.01, ns: not significant. AU: arbitrary unit. |