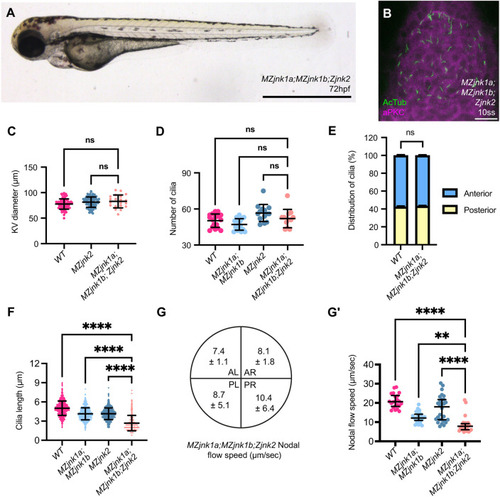
jnk1a, jnk1b and jnk2 function together in nodal cilia development and KV function. (A) Representative bright-field image of MZjnk1a;MZjnk1b;Zjnk2 embryo at 3 dpf. (B) Representative MZjnk1a;MZjnk1b;Zjnk2 KVs at 10 ss labelling acetylated tubulin (green) and aPKC (magenta). (C) KV diameter quantification in wild type, and in MZjnk2 and MZjnk1a;MZjnk1b;Zjnk2 mutant embryos at 8 ss. KV size is not impacted by loss of jnk1 and jnk2 function. (D) Quantification of number of cilia in wild type, and in MZjnk1a;MZjnk1b, MZjnk2 and MZjnk1a;MZjnk1b;Zjnk2 mutant embryos at 10 ss. Loss of jnk1a, jnk1b and jnk2 does not impact cilia number in KV. (E) Quantification of nodal cilia distribution in wild-type and MZjnk1a;MZjnk1b;Zjnk2 embryos at 10 ss. Antero-posterior distribution of nodal cilia is unaffected by loss of jnk2 in a jnk1-null background. (F) Quantification of length of nodal cilial in wild type, and in MZjnk1a;MZjnk1b, MZjnk2 and MZjnk1a;MZjnk1b;Zjnk2 mutant embryos at 10 ss. MZjnk1a;MZjnk1b;Zjnk2 mutant embryos have a greater reduction in the length of nodal cilia compared with MZjnk1a;MZjnk1b or MZjnk2 mutants. (G,G′) Quantification of nodal flow speed in MZjnk1a;MZjnk1b;Zjnk2 by quadrant (µm/s; data are mean±s.d.) (G) and average speed (G′) between 10 and 14 ss. MZjnk1a;MZjnk1b;Zjnk2 mutant embryos have a greater reduction in the average speed of nodal flow compared with MZjnk1a;MZjnk1b or MZjnk2 mutants. (C) Data are mean±s.d., one-way ANOVA, multiple comparisons. MZjnk1a;MZjnk1b;Zjnk2, n=20. Wild-type data are from Fig. S1B. MZjnk2 data are from Fig. S2C. (D) Data are mean±s.d., one-way ANOVA, multiple comparisons. MZjnk1a;MZjnk1b;Zjnk2, n=12. Wild-type and MZjnk1a;MZjnk1b data are from Fig. 1F. MZjnk2 data are from Fig. 4C. (E) Data are mean±s.e.m., two-way ANOVA, multiple comparisons. MZjnk1a;MZjnk1b;Zjnk2, n=14. Wild-type data are from Fig. 1G. (F) Data are mean±s.d., one-way ANOVA, multiple comparisons. MZjnk1a;MZjnk1b;Zjnk2, n=466. Wild-type and MZjnk1a;MZjnk1b data are from Fig. 1H. MZjnk2 data are from Fig. 4D. (G′) Data are median±interquartile range, Kruskal–Wallis test, multiple comparisons, MZjnk1a;MZjnk1b;Zjnk2, n=28 beads across three embryos. Wild-type and MZjnk1a;MZjnk1b data are from Fig. 2F. MZjnk2 data are from Fig. 4E′. (A) Lateral view, anterior leftwards. Scale bar: 1 mm. (B) Anterior upwards. Scale bar: 20 µm. ns, not significant. **P<0.01, ****P<0.0001. AL, anterior left; AR, anterior right; PL, posterior left; PR, posterior right.
|
