
- Title
-
Sequential action of jnk genes establishes the embryonic left-right axis
- Authors
- Derrick, C.J., Santos-Ledo, A., Eley, L., Henderson, D.J., Chaudhry, B.
- Source
- Full text @ Development
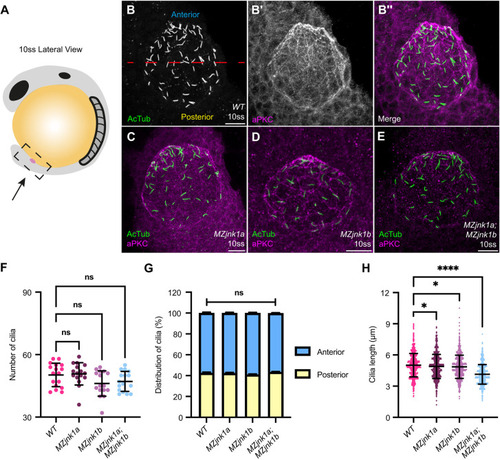
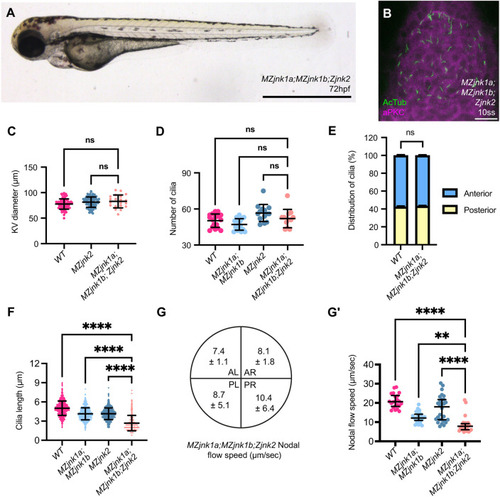
EXPRESSION / LABELING:
PHENOTYPE:
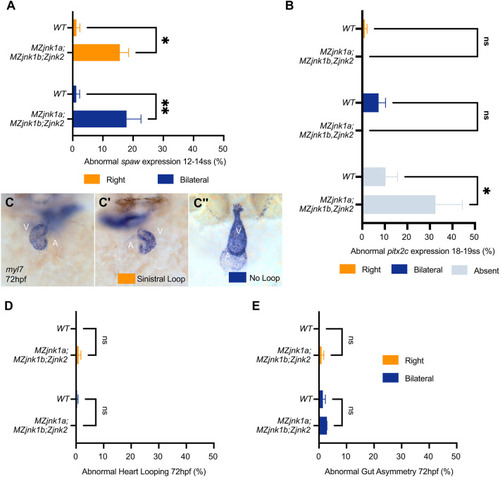
|
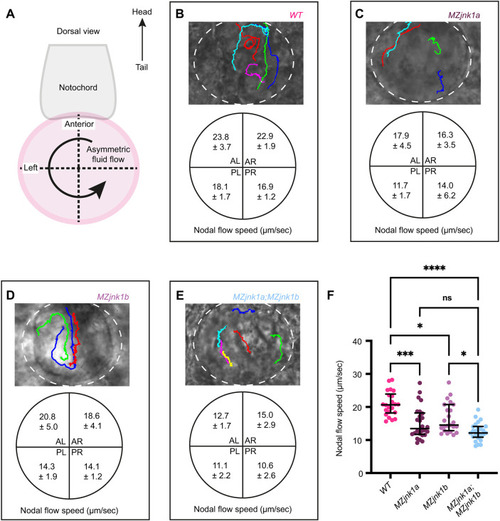
|
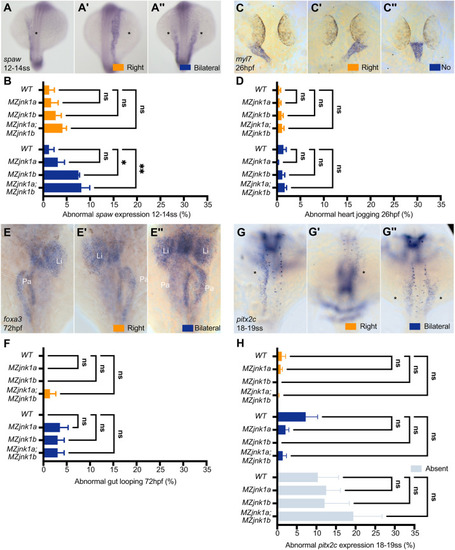
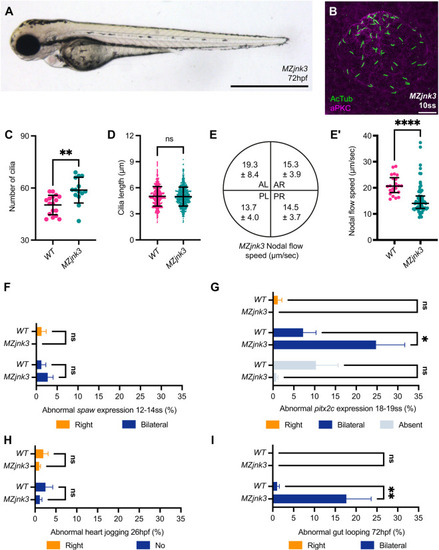
EXPRESSION / LABELING:
PHENOTYPE:
|
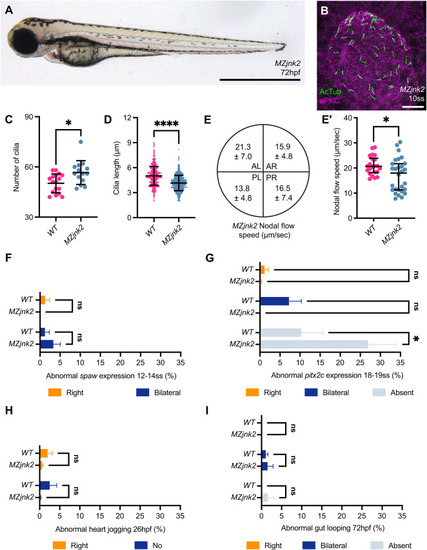
EXPRESSION / LABELING:
PHENOTYPE:
|
EXPRESSION / LABELING:
PHENOTYPE:
|
EXPRESSION / LABELING:
PHENOTYPE:
|
EXPRESSION / LABELING:
PHENOTYPE:
|
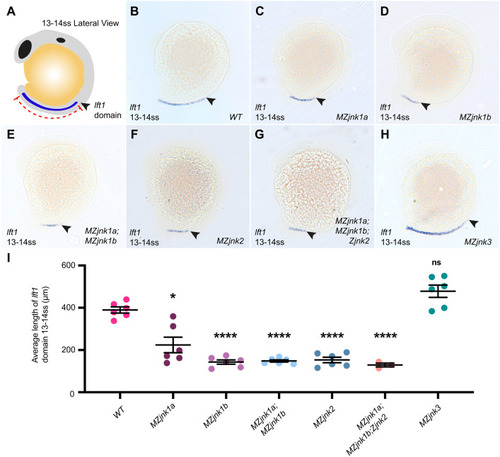
EXPRESSION / LABELING:
PHENOTYPE:
|