
Fig. 2
- ID
- ZDB-FIG-220715-27
- Publication
- Santistevan et al., 2022 - cacna2d3, a voltage-gated calcium channel subunit, functions in vertebrate habituation learning and the startle sensitivity threshold
- Other Figures
- All Figure Page
- Back to All Figure Page
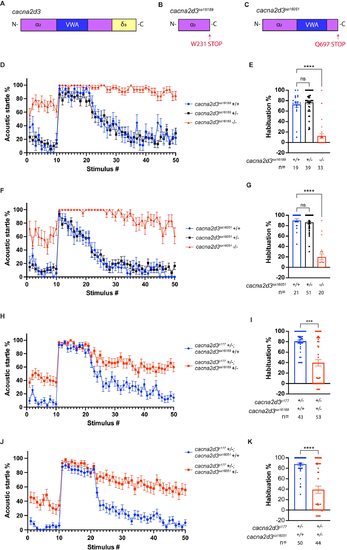
Fig 2. cacna2d3 mutants and trans-heterozygotes exhibit reduced ASR habituation. (A-C) Schematics of the wild-type cacna2d3 allele (A), the cacna2d3sa16189 mutant allele (B), and the cacna2d3sa16051 mutant allele (C). (D) Mean acoustic startle responsiveness to each stimulus in the habituation assay. Animals were generated from a cacna2d3sa16189/+ incross. Wild-type larvae are shown in blue, cacna2d3sa16189/+ heterozygotes are shown in black, and homozygous cacna2d3sa16189 mutants are shown in red. (E) Mean acoustic startle habituation percentage. (F) Mean acoustic startle responsiveness to each stimulus of the habituation assay. Animals were generated from a cacna2d3sa16051/+ incross. Wild-type larvae are shown in blue, cacna2d3sa16051/+ heterozygotes are shown in black, and homozygous cacna2d3sa16051 mutants are shown in red. (G) Mean acoustic startle habituation percentage. (E, G) ***p<0.001, ****p<0.0001, one-way ANOVA with Dunnett’s multiple comparison test. (H) Mean acoustic startle responsiveness to each stimulus of the habituation assay. Animals were generated from a cross between cacna2d3p177 mutants with cacna2d3sa16189/+ heterozygotes. cacna2d3p177/+ larvae are shown in blue and cacna2d3p177/cacna2d3sa16189 trans-heterozygotes are shown in red. (I) Mean acoustic startle habituation percentage. (J) Mean acoustic startle responsiveness to each stimulus of the habituation assay. Animals were generated from a cross between cacna2d3p177 mutants and cacna2d3sa16051/+ heterozygotes. cacna2d3p177/+ larvae are shown in blue and cacna2d3p177/cacna2d3sa16051 trans-heterozygotes are shown in red. (K) Mean acoustic startle habituation percentage. (I, K) ***p<0.001, ****p<0.0001, Mann-Whitney test versus wild-type. For all panels, the number of larvae analyzed is shown below each bar. Error bars indicate SEM. |
| Fish: | |
|---|---|
| Observed In: | |
| Stage: | Day 5 |