
- Title
-
cacna2d3, a voltage-gated calcium channel subunit, functions in vertebrate habituation learning and the startle sensitivity threshold
- Authors
- Santistevan, N.J., Nelson, J.C., Ortiz, E.A., Miller, A.H., Kenj Halabi, D., Sippl, Z.A., Granato, M., Grinblat, Y.
- Source
- Full text @ PLoS One
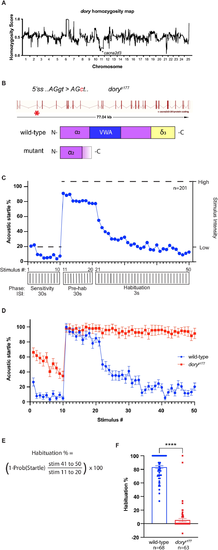
Fig 1. doryp177, linked to cacna2d3 by homozygosity analysis, causes reduced habituation of the acoustic startle response. (A) Homozygosity plot of doryp177 mutants based on whole genome sequencing results. Homozygosity scores close to 1.0 indicate linkage to TL alleles while scores close to 0.0 indicate linkage to WIK alleles. Asterisk indicates the position of the identified splice-donor site mutation in cacna2d3 on chromosome 11. (B) Schematics of the cacna2d3 gene and the amino acid sequences encoded by the wild-type cacna2d3 allele and the doryp177 mutant allele. In the cacna2d3 gene diagram, the site of the point mutation in doryp177 mutants is indicated by a red asterisk. (C) Schematic representation of the acoustic startle habituation assay. Larvae were exposed to 10 “sub-threshold” low-intensity acoustic stimuli delivered at 30s interstimulus intervals (ISI) to access startle sensitivity. Next larvae were exposed to 10 high-intensity non-habituating stimuli delivered at 30s ISI to determine baseline startle responsiveness followed by 30 high intensity habituating stimuli at a 3s ISI to access habituation. The blue plot was generated by pooling control animal responses to demonstrate a typical wild-type response at each phase of the assay. (D) Mean acoustic startle responsiveness of wild-type (shown in blue) and doryp177 mutants (shown in red) to each of the stimuli presented during the habituation assay. (E) Mean acoustic startle habituation percentage is calculated by taking the ratio of the mean frequency of startle responsiveness (startle probability) of each larva to stimuli 41–50 over stimuli 11–20. (F) Mean acoustic startle habituation percentage of wild-type and doryp177 mutants. Wild-type larvae are shown in blue and homozygous doryp177 mutants are shown in red. Number of larvae shown below each bar. ****p<0.0001, Mann-Whitney test versus wild-type. Error bars indicate SEM. PHENOTYPE:
|
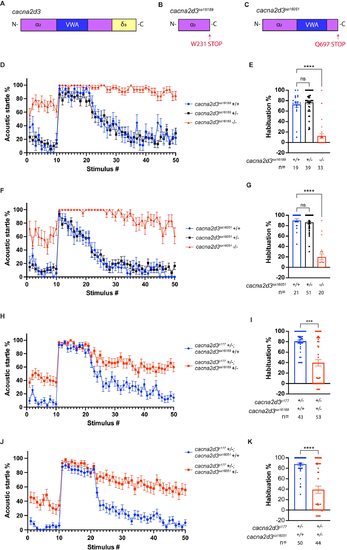
Fig 2. cacna2d3 mutants and trans-heterozygotes exhibit reduced ASR habituation. (A-C) Schematics of the wild-type cacna2d3 allele (A), the cacna2d3sa16189 mutant allele (B), and the cacna2d3sa16051 mutant allele (C). (D) Mean acoustic startle responsiveness to each stimulus in the habituation assay. Animals were generated from a cacna2d3sa16189/+ incross. Wild-type larvae are shown in blue, cacna2d3sa16189/+ heterozygotes are shown in black, and homozygous cacna2d3sa16189 mutants are shown in red. (E) Mean acoustic startle habituation percentage. (F) Mean acoustic startle responsiveness to each stimulus of the habituation assay. Animals were generated from a cacna2d3sa16051/+ incross. Wild-type larvae are shown in blue, cacna2d3sa16051/+ heterozygotes are shown in black, and homozygous cacna2d3sa16051 mutants are shown in red. (G) Mean acoustic startle habituation percentage. (E, G) ***p<0.001, ****p<0.0001, one-way ANOVA with Dunnett’s multiple comparison test. (H) Mean acoustic startle responsiveness to each stimulus of the habituation assay. Animals were generated from a cross between cacna2d3p177 mutants with cacna2d3sa16189/+ heterozygotes. cacna2d3p177/+ larvae are shown in blue and cacna2d3p177/cacna2d3sa16189 trans-heterozygotes are shown in red. (I) Mean acoustic startle habituation percentage. (J) Mean acoustic startle responsiveness to each stimulus of the habituation assay. Animals were generated from a cross between cacna2d3p177 mutants and cacna2d3sa16051/+ heterozygotes. cacna2d3p177/+ larvae are shown in blue and cacna2d3p177/cacna2d3sa16051 trans-heterozygotes are shown in red. (K) Mean acoustic startle habituation percentage. (I, K) ***p<0.001, ****p<0.0001, Mann-Whitney test versus wild-type. For all panels, the number of larvae analyzed is shown below each bar. Error bars indicate SEM. |
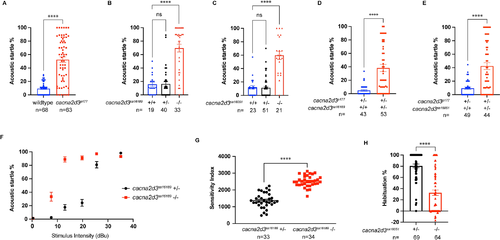
Fig 3. The startle threshold is reduced in cacna2d3 mutants. (A-E) Acoustic startle (SLC) responsiveness of cacna2d3 mutants to the 10, low-level acoustic stimuli presented during the “sensitivity” phase of the habituation assay. Startle response of (A) wild-type (shown in blue) and cacna2d3p177 mutants (shown in red). Startle response of (B) cacna2d3sa16189 wild-type (shown in blue), heterozygous (shown in black) and mutant larvae (shown in red). Startle response of (C) cacna2d3sa16051 wild-type (shown in blue), heterozygous (shown in black) and mutant larvae (shown in red). (B, C) ****p<0.0001, one-way ANOVA with Dunnett’s multiple comparison test. Startle response of (D) doryp177/+ sibling larvae (shown in blue) and cacna2d3p177/ cacna2d3sa16189 trans-heterozygous larvae (shown in red). Startle response of doryp177/+; siblings (shown in blue) and cacna2d3p177/cacna2d3sa16051 trans-heterozygous larvae (shown in red). (A, D, E) ****p<0.0001, unpaired t-test with Welch’s correction versus wild-type. (F) Startle frequency for 30 trials at 6 stimulus intensities. cacna2d3sa16189/+ heterozygotes are in black and cacna2d3sa16189 mutants are in red. (G) Mean startle sensitivity indices. ****p<0.0001, unpaired t-test with Welch’s correction versus heterozygotes. (H) Mean acoustic startle habituation percentage from a cross of cacna2d3sa16051/+ heterozygotes and cacna2d3sa16051 mutants with a lowered acoustic intensity. cacna2d3sa16051/+ heterozygotes are shown in black, and homozygous cacna2d3sa16051 mutants are shown in red. ****p<0.0001, unpaired t-test with Welch’s correction versus heterozygotes. For all panels, the number of larvae analyzed is shown below each bar. Error bars indicate SEM. PHENOTYPE:
|
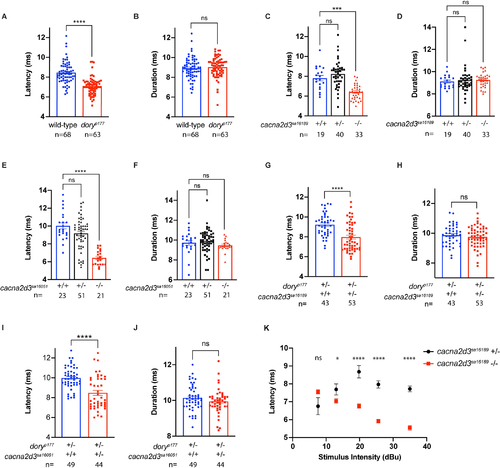
Fig 4. cacna2d3 mutants and trans-heterozygotes exhibit decreased startle latency. Startle kinematic analysis of C-turn latency and C-turn duration. (A) Latency and (B) duration analysis and of wild-type (shown in blue) and cacna2d3p177 mutants (shown in red). (A-B) ns, ****p<0.0001, Mann-Whitney test versus wild-type. (C) Latency and (D) duration analysis of cacna2d3sa16189 wild-type (shown in blue), heterozygous (shown in black) and mutant larvae (shown in red). (E) Latency and (F) duration analysis of cacna2d3sa16051 wild-type (shown in blue), heterozygous (shown in black) and mutant larvae (shown in red). (C, E) ***p<0.001, ****p<0.0001, one-way ANOVA with Dunnett’s multiple comparison test versus wild-type. |