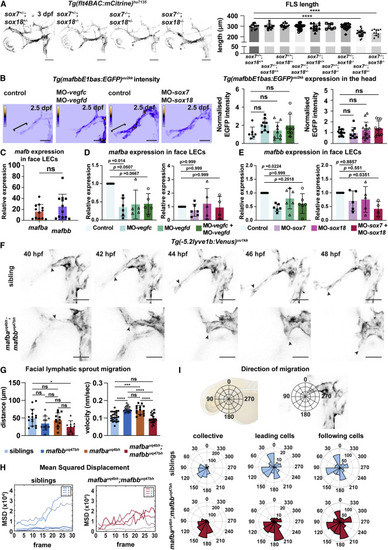
Figure 4. mafba and mafbb regulate facial LEC migration downstream of Vegfc-Vegfd-SoxF
(A) (Left) Confocal images of Tg(flt4BAC:mCitrine) expression in facial lymphatics in sibling, sox7+/−;sox18−/−, sox7−/−;sox18+/−, and sox7−/−;sox18−/− embryos at 3 dpf. ∗: reduced sprout length. Scale bars, 100 μm. (Right) Quantification of facial lymphatic sprout length at 3 dpf in sox7 and sox18 mutant backgrounds. sox7+/+;sox18+/+ n = 12; sox7+/−;sox18+/+ and sox7−/−;sox18+/+ n = 13; sox7+/+;sox18+/− n = 18; sox7+/−;sox18+/− n = 30; sox7+/+;sox18−/− n = 7; sox7+/−;sox18−/− n = 17; sox7−/−;sox18+/− n = 32; sox7−/−;sox18−/− n = 11. One-way ANOVA: ∗∗∗∗p < 0.0001 for sox7+/+;sox18+/+ versus sox7−/−;sox18+/− or sox7−/−;sox18−/−; other comparisons: p > 0.9782.
(B) (Top) Heatmap of Tg(mafbbE1bas:EGFP) signal intensity from confocal projection at 2.5 dpf in face LECs. Gray value intensity scale: 0–113 for control and MO-vegfc + MO-vegfd, scale: 0–147 for control and MO-sox7+MO-sox18. White bracket: quantification area. Scale bar, 50 μm. (Bottom) Quantification of Tg(mafbbE1bas:EGFP) intensity. (Left) Control n = 7; MO-vegfd and MO-vegfc n = 9; MO-vegfc + vegfd n = 8; (right) control n = 17; MO-sox7 n = 9; MO-sox18 n = 14; MO-sox7 + sox18 n = 10. Kruskal-Wallis test: ns p > 0.2372.
(C) Quantitative real-time PCR of mafba and mafbb expression relative to cdh5 in facial LECs at 48 hpf. 12 replicates. Wilcoxon test: ns p = 0.3013.
(D and E) Quantitative real-time PCR of mafba and mafbb expression in face LECs at 48 hpf. (D, left) 6 replicates for control and MO-vegfc and 5 for MO-vegfd and MO-vegfc + vegfd; expression relative to cdh5. (D, right) 6 replicates for control, MO-sox7, 5 for MO-sox18, and 4 for MO-sox7+MO-sox18; expression relative to B actin. (E, left) 6 replicates for control, MO-vegfd, MO-vegfc, and MO-vegfc + vegfd; expression relative to cdh5. (E, right) 6 replicates for control, 5 for MO-sox7 and MO-sox18, and 4 for MO-sox7+MO-sox18; expression relative to B actin. Kruskal-Wallis: p values reported on the graph.
(F) Confocal projections from time-lapse imaging of LEC migration in siblings and double mutants labeled by Tg(-5.2lyve1b:Venus) from 40–48 hpf. Arrows: leading cells in FLS. Scale bars, 50 μm.
(G) (Left) FLS migratory distance (from F). Embryos: siblings n = 15, mafbb n = 11, mafba n = 12; double mutants n = 9. One-way ANOVA: ∗p = 0.0279 for siblings versus double mutants; ns for all other comparisons. (Right) FLS migratory velocity (from F). Cells: siblings n = 24, mafbb n = 16, mafba n = 14; double mutants n = 29. One-way ANOVA: ∗∗∗∗p < 0.0001 for siblings versus mafbb, and mafbb or mafba versus double mutants; ∗∗∗p = 0.0001 for siblings versus mafba; ns for all other comparisons.
(H) FLS tip mean-squared displacement (MSD) (from F) in siblings (n = 4) and double mutants (n = 4).
(I) (Top) Schematic representation of directionality in the polar histograms. (Bottom) Polar histograms of migration tracked (from F) in siblings (n = 4) and double mutants (n = 4). Collective cells: siblings n = 24 and double mutants n = 29; leading cells: siblings n = 4 and double mutants n = 4; following cells: siblings n = 20 and double mutants n = 25. ns, non-significant; stars are significant; mean with SD.